TEACH THE MECHANICS
A forex classroom, ready to adapt.
Use a diagram, set a problem and ask learners to explain their result. This English teaching pack brings together printable exercises, worked answers and short lesson plans around the same ten hypothetical cases.
Version 1.0.0 27 October 2026 No sign-up
- 20
- editable diagrams
- 10
- exercises + answers
- 5
- 40-minute lessons
Start here: download the student workbook for learners and keep the teacher guide separate. All numbers are invented teaching inputs. These materials check reasoning within stated assumptions; they do not assess trading readiness or demonstrate a profitable strategy.
Print, present or work offline
FOR LEARNERS
Student workbook
Ten self-contained problems with room for a decision, calculation and explanation. No answer key in this document.
FOR TEACHERS
Teacher guide
Worked arithmetic, decision feedback, common mistakes and five timed lesson plans. Includes the answers.
FOR YOUR OWN MATERIALS
Editable source pack
SVG and PNG diagrams, editable HTML handouts, PDFs, lesson plans, widget snippets and a manifest of file hashes.
The ZIP opens offline: extract it and open index.html. Calculator widgets and links to the online course need an internet connection. PDFs use A4 pages; print scaling may be needed for other paper sizes.
Choose a 40-minute lesson
Each lesson pairs two exercises, includes a discussion and ends with a short explanation check. Timings are teaching plans, not measured learner completion times.
L01 · 40 MINUTES
From a risk budget to an account check
- Convert pip value into the account currency before calculating position size.
- Round volume down to the supplied lot step and verify the planned loss.
- Keep position margin, free margin and planned stop-loss risk as separate quantities.
View lesson sequence
- 4 min - Name the quantities
Ask learners to label a risk budget, pip value, lot size, margin and free margin with their units. Collect a first answer before discussing it.
- 5 min - Trace the currency conversion
Use D02-D04 to trace contract units to quote-currency pip value and then account-currency pip value. Ask where the familiar 10-per-pip shortcut would fail in E01.
- 10 min - Exercise E01: size the yen position
Learners calculate independently, show the units and round down to the stated lot step. They then check the jpy-position case in Decision Lab and explain any correction. Enter the exercise assumptions explicitly when using a calculator.
- 5 min - Separate collateral from a loss budget
Use D13-D14 to distinguish existing used margin, the new margin requirement, remaining free margin and the separate stop-loss budget. Available margin is not a recommendation to open a position.
- 10 min - Exercise E06: check the account
Learners calculate the new notional, margin requirement and post-position free margin before checking the margin-risk case. Compare these with the separately calculated planned price-move loss.
- 6 min - Explain and check
Pairs identify one unit error and one margin-versus-risk error the examples prevent. Finish with the individual check questions; record the explanation as well as the number.
Inputs are synthetic and fixed. E01 excludes execution costs; E06 uses a simple leverage model without tiers or offsets. Planned stop-loss loss and free margin do not bound an actual trade's loss. Neither calculation establishes a safe risk percentage or broker-specific account rules.
L02 · 40 MINUTES
Execution costs and the price of a fill
- Label results as gross or net and deduct an additional cost exactly once.
- Express the supplied pip cost in units of the stated initial risk, R.
- Calculate a realised loss from a supplied fill distance instead of assuming execution at the planned stop.
View lesson sequence
- 4 min - Read the labels first
Present E02's gross results and ask whether a cost has already been included. Each learner states what 1R means before calculating.
- 6 min - Build one gross-to-net bridge
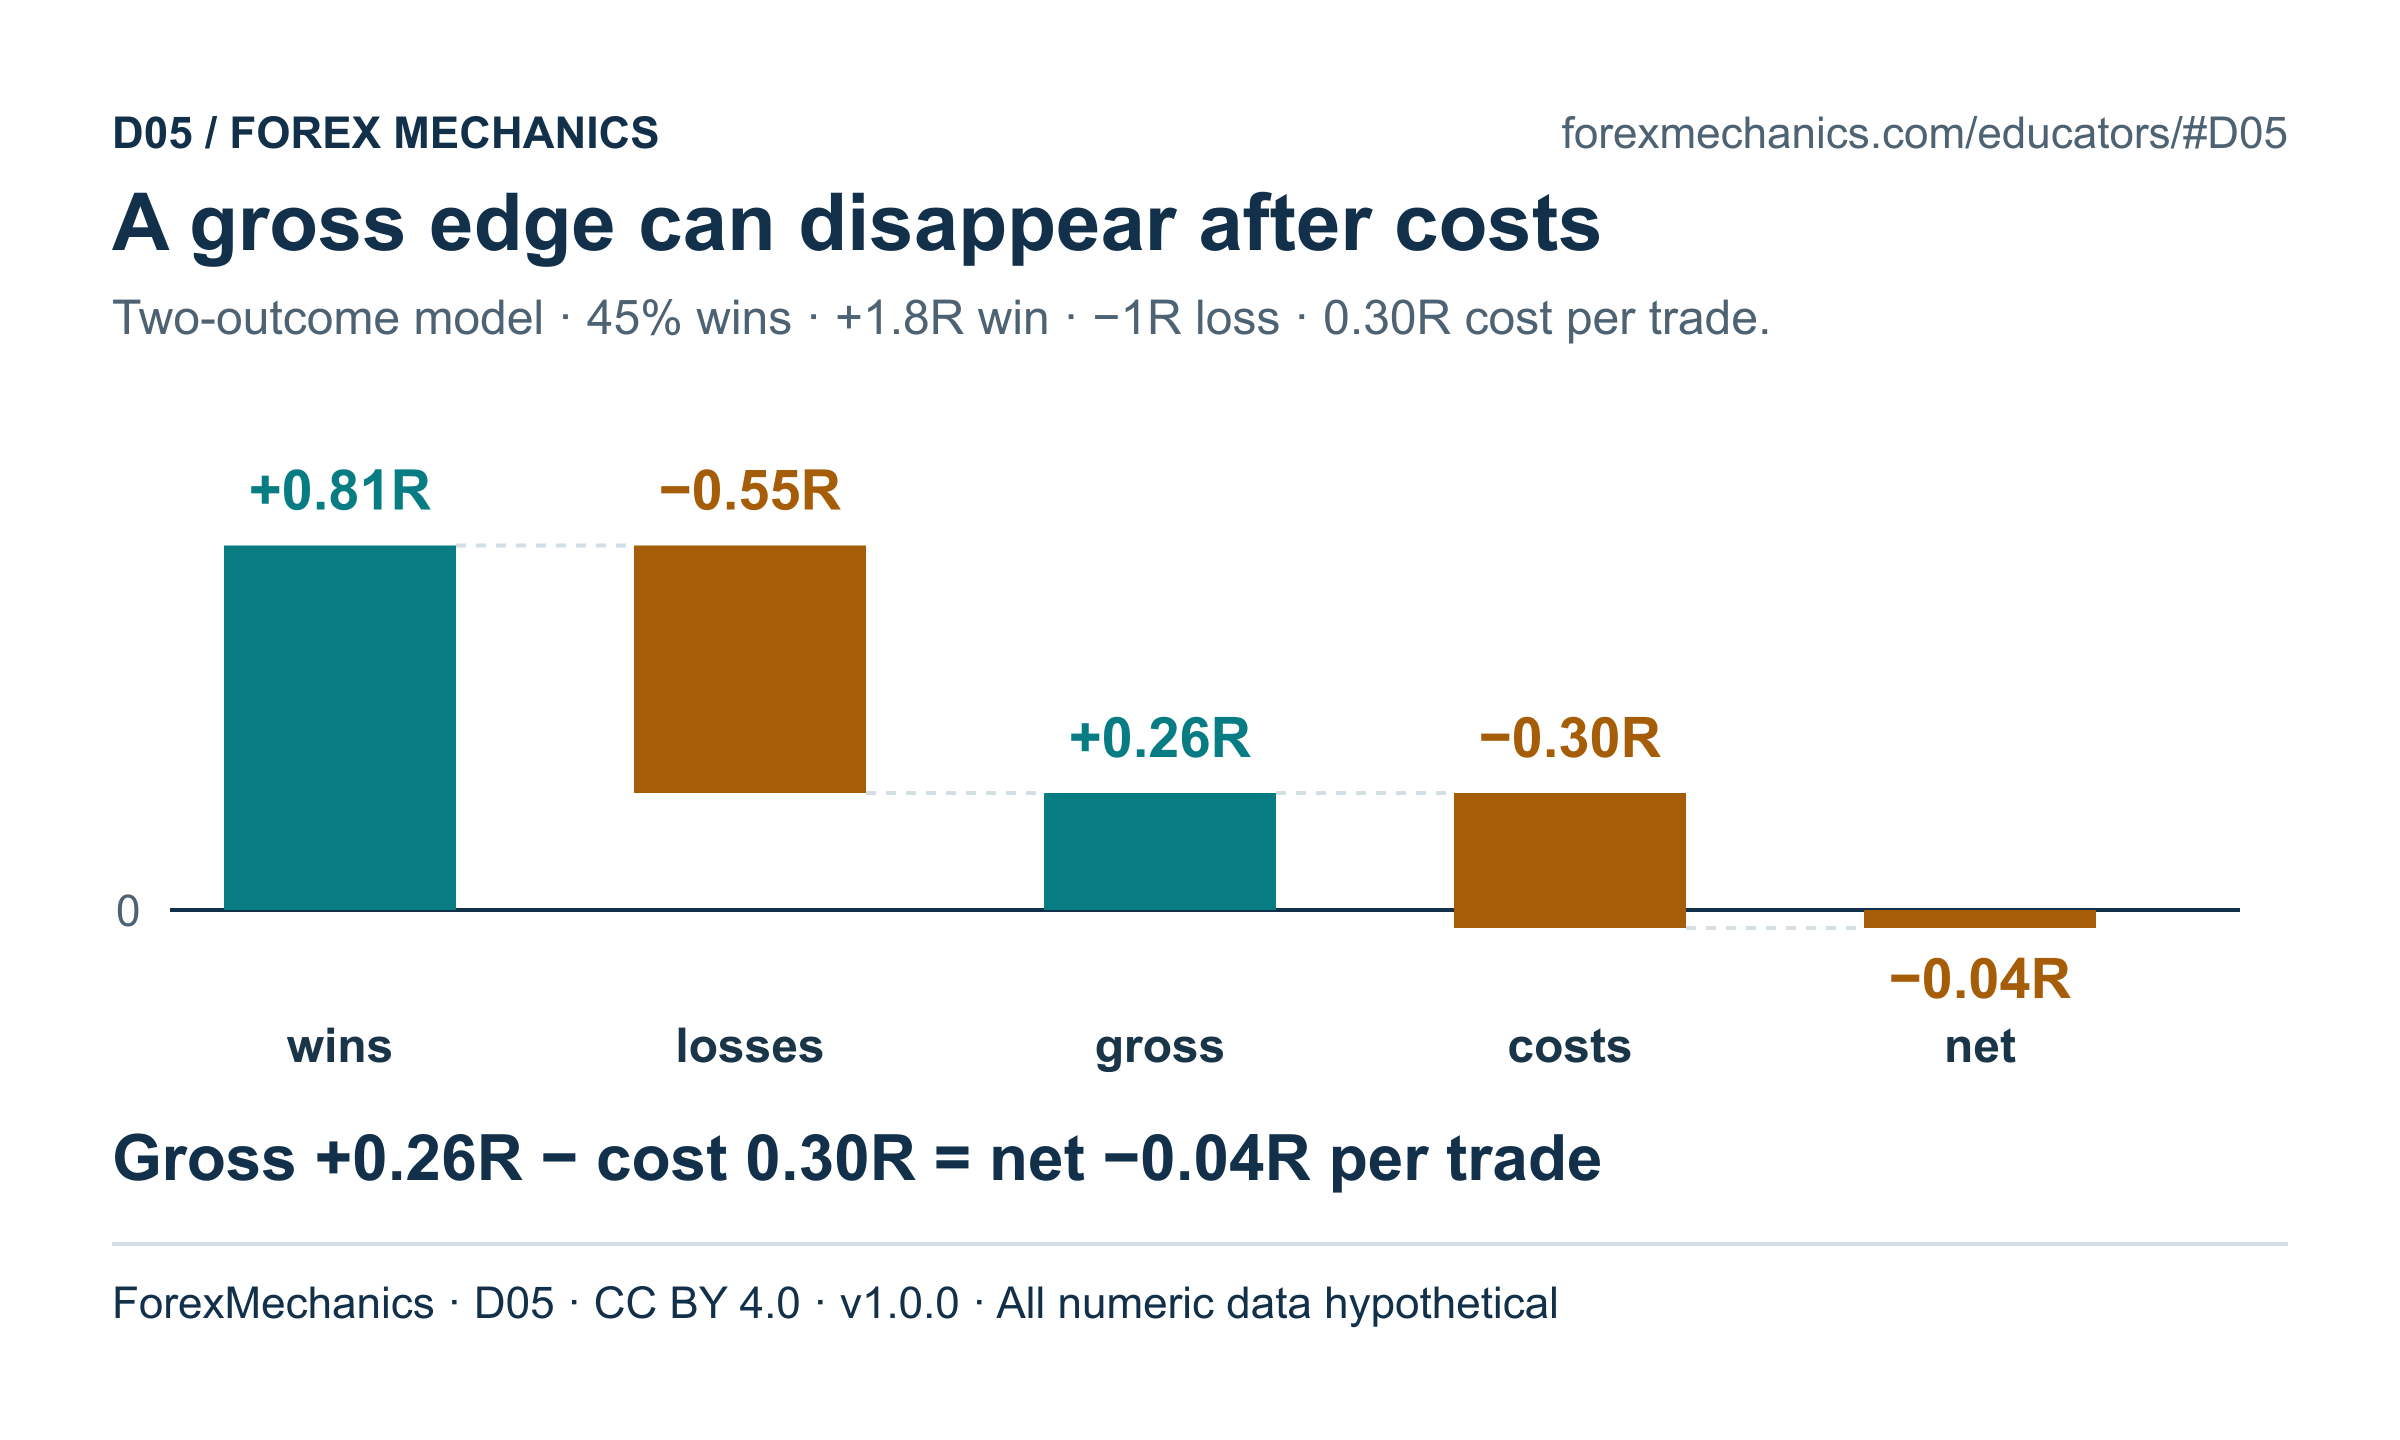
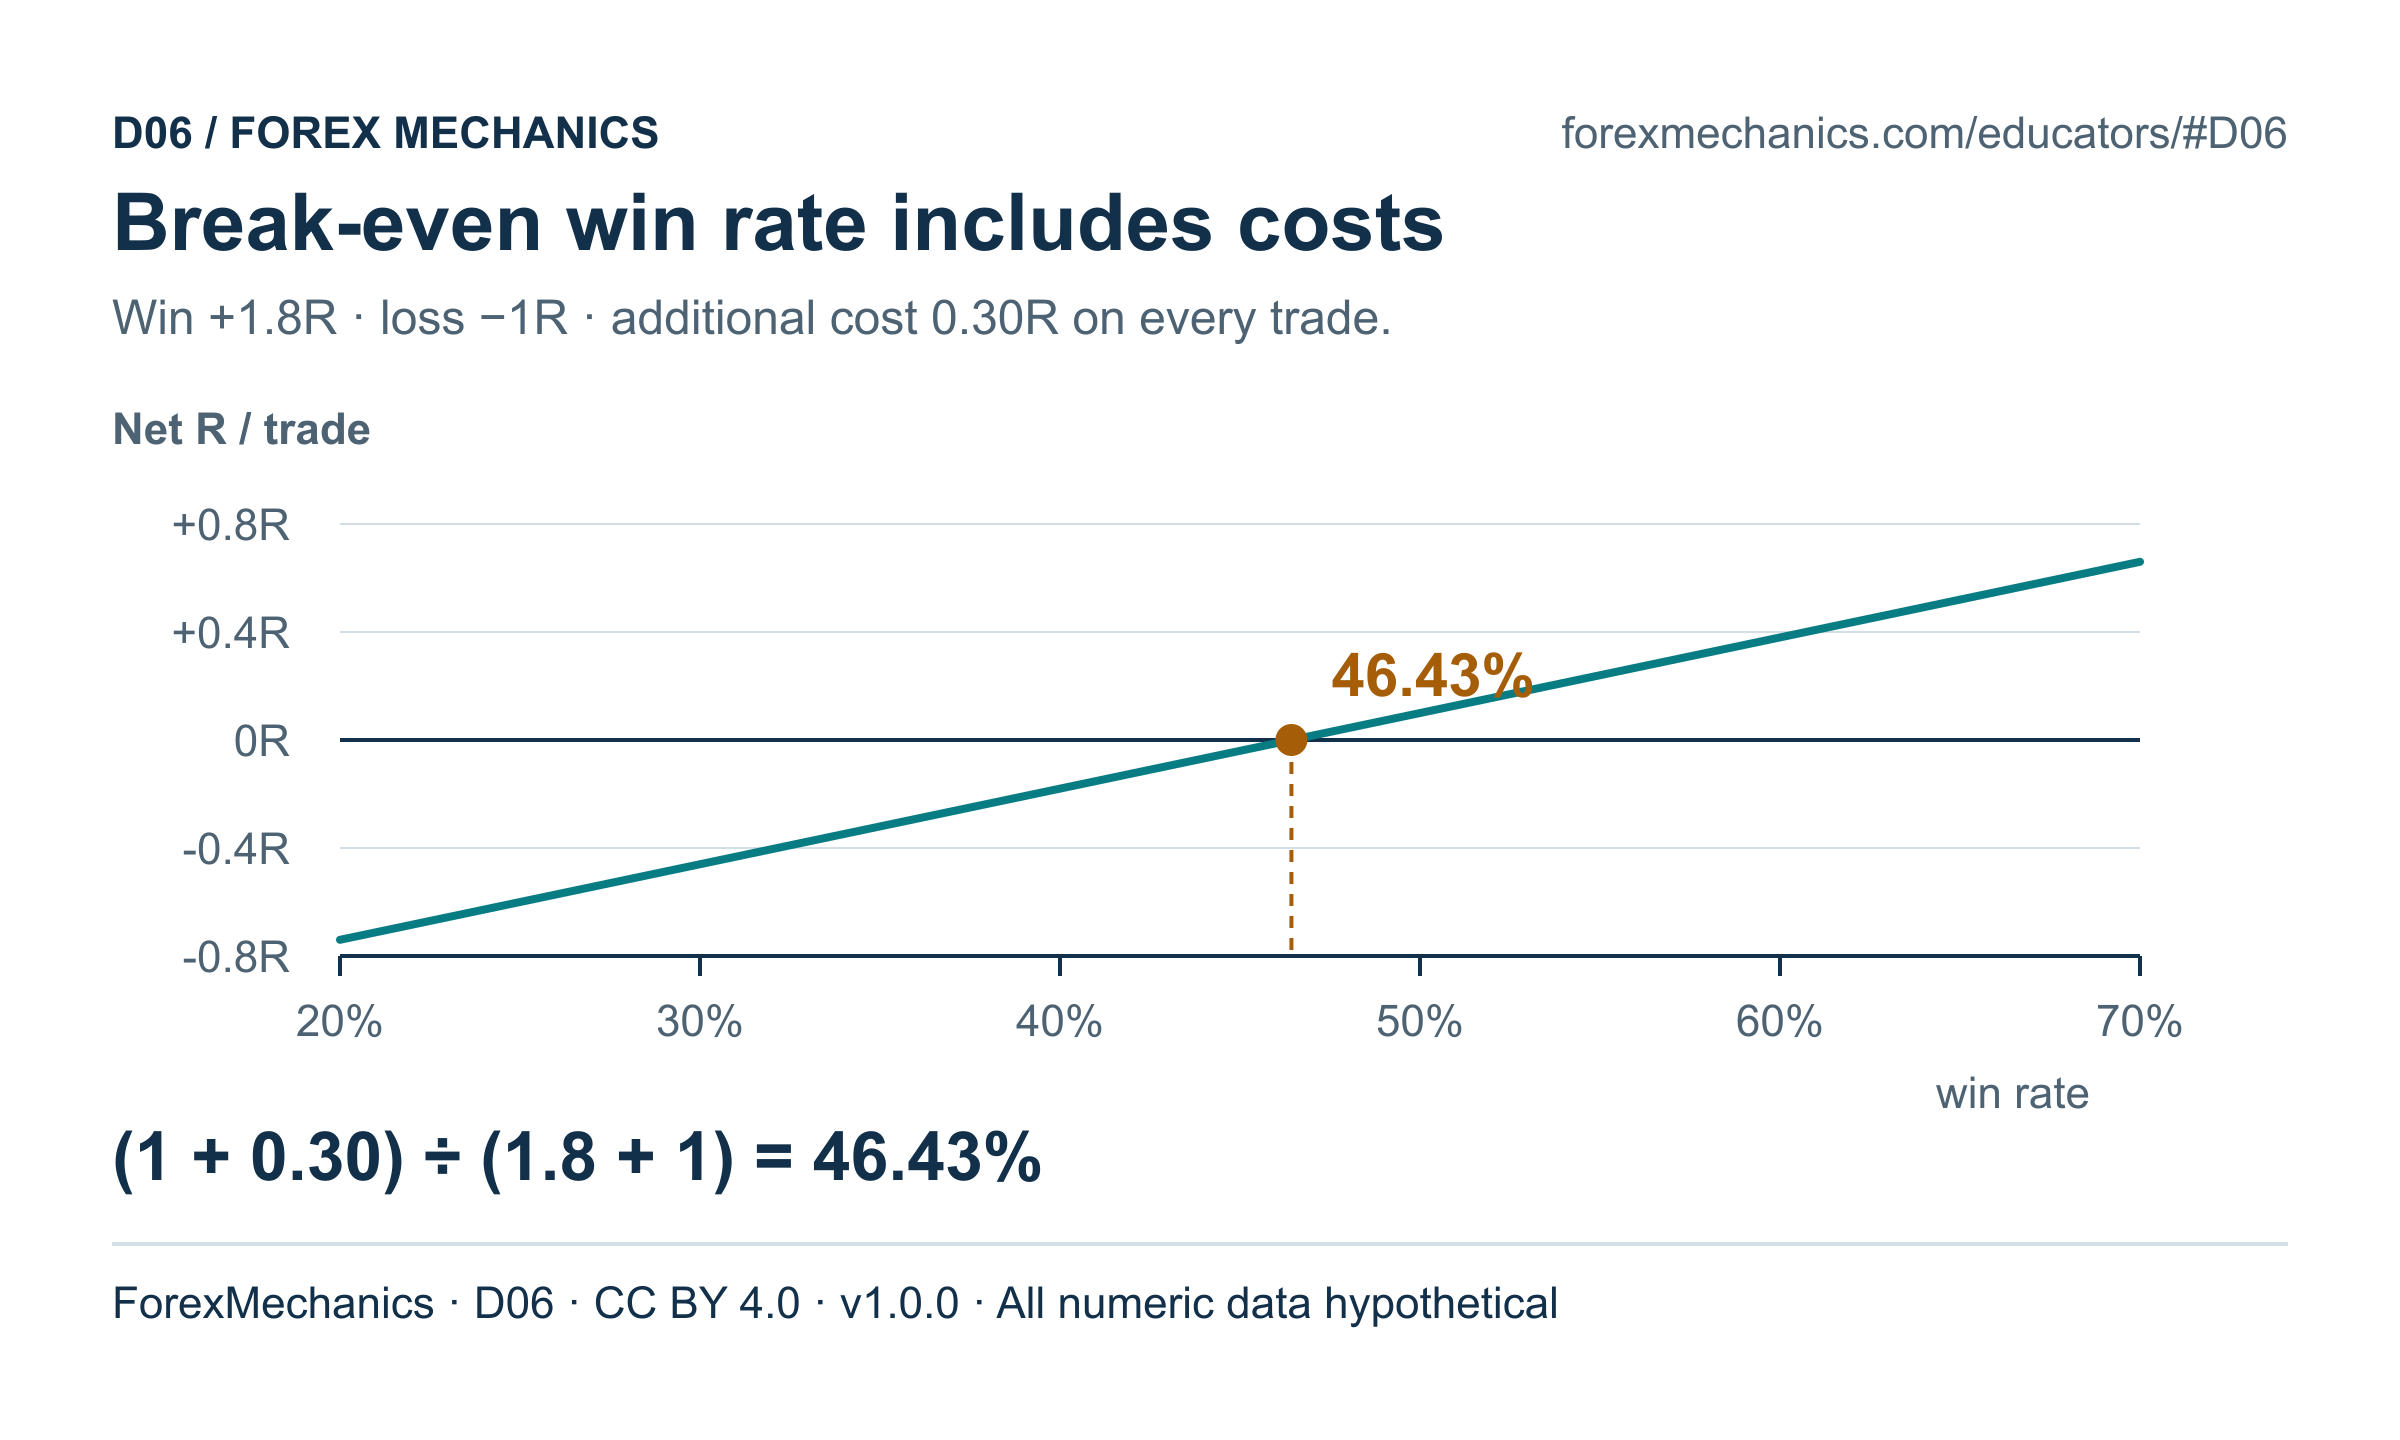
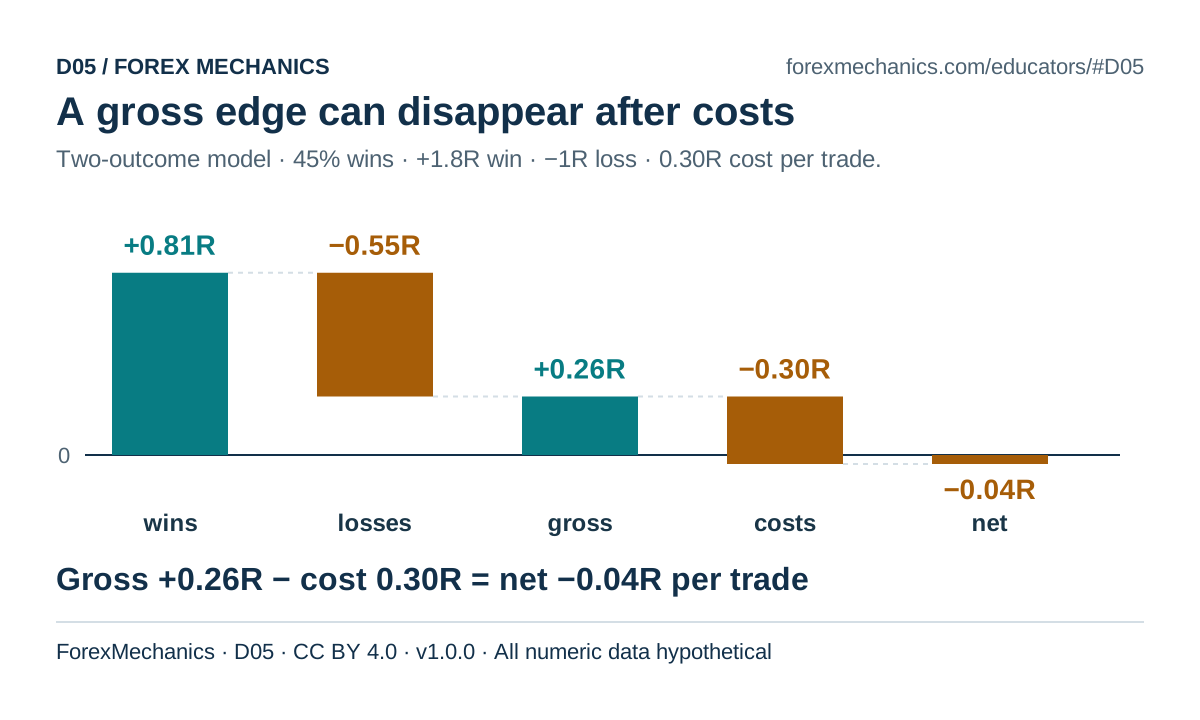
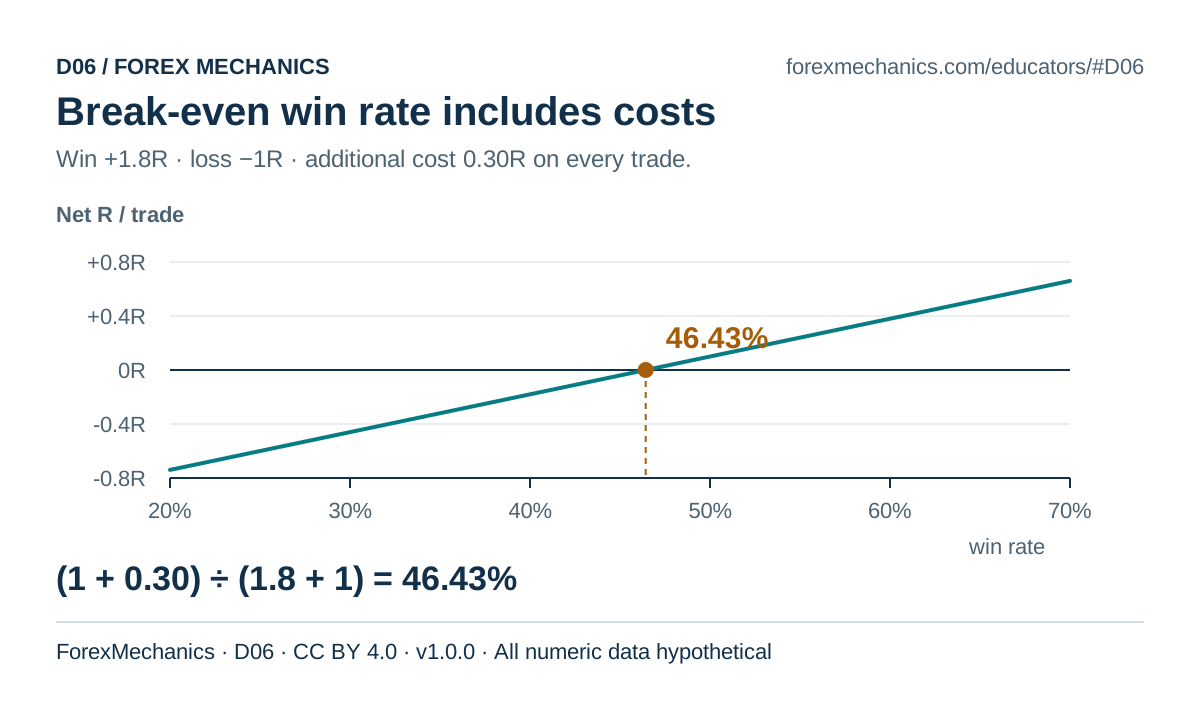
Use D05-D06 to separate gross expectancy, additional cost in R and net expectancy. Mark where a second deduction would count the same cost twice.
- 10 min - Exercise E02: does the stated edge survive?
Learners calculate gross expectancy, convert the 1.5-pip additional cost into R and derive net expectancy. Check the execution-costs case, then compare with the expectancy calculator using the same assumptions.
- 5 min - Compare a stop instruction with a fill
Use D15 to distinguish E07's planned 20-pip stop from its supplied 35-pip adverse closing distance. Ask what evidence would be needed to analyse a real execution rather than this supplied example.
- 9 min - Exercise E07: reconcile the loss
Learners calculate price-move loss and round-trip commission separately, then add them once. Check the gap-execution case and reproduce it in the profit/loss calculator where the supplied assumptions can be entered.
- 6 min - Exit check
Learners explain one omission and one double-counting error. Use the check questions independently; require a gross/net label or cost label on each answer.
These are synthetic examples, not measured execution quality or a future cost distribution. The gross-to-net example holds win rate and payoffs fixed. Changing a stop can change a strategy's outcomes; the cost ratio alone cannot select a better stop. Actual order handling depends on product, order terms and broker.
L03 · 40 MINUTES
Read the whole position: exposure and partial exits
- Represent a supplied FX position with signed base- and quote-currency legs.
- Distinguish shared currency exposure from summed planned stop-loss budgets.
- Weight partial exits by volume and reconcile one full-trade net result in the original R units.
View lesson sequence
- 4 min - State the unit and scope
Ask what a pair name hides about its two currency legs and what a partial exit hides about the remaining position. Learners label exposure, cash P&L and R as different measures.
- 6 min - Build a currency-leg table
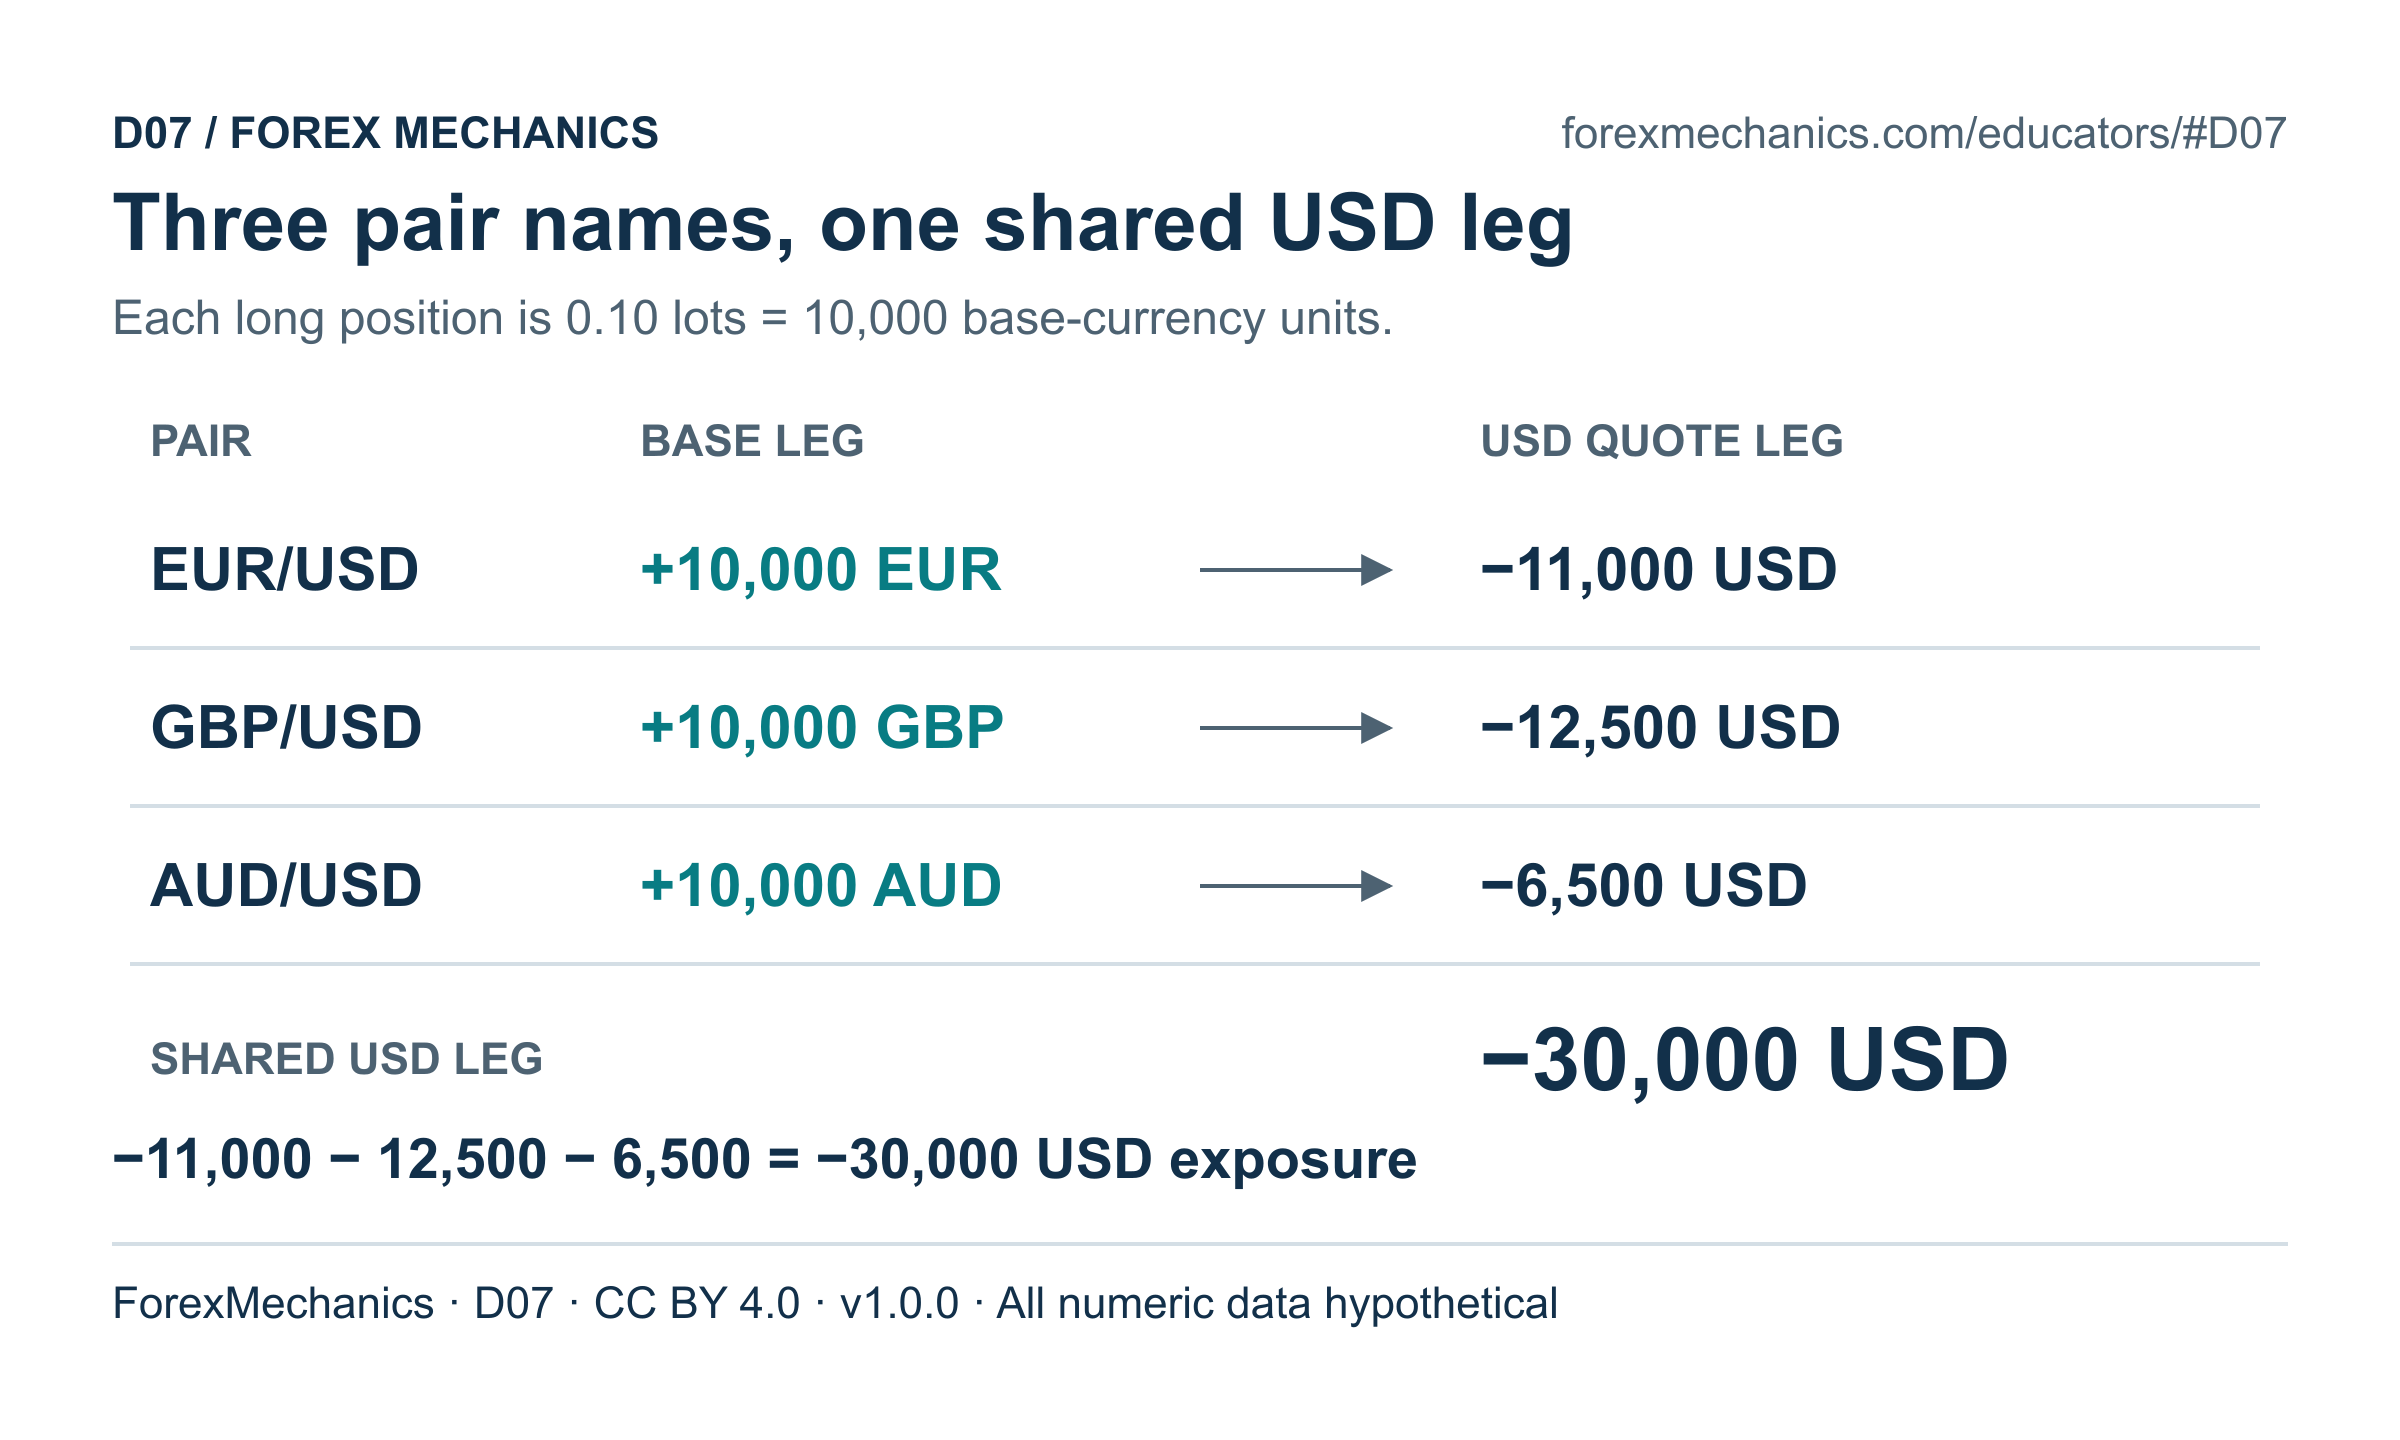
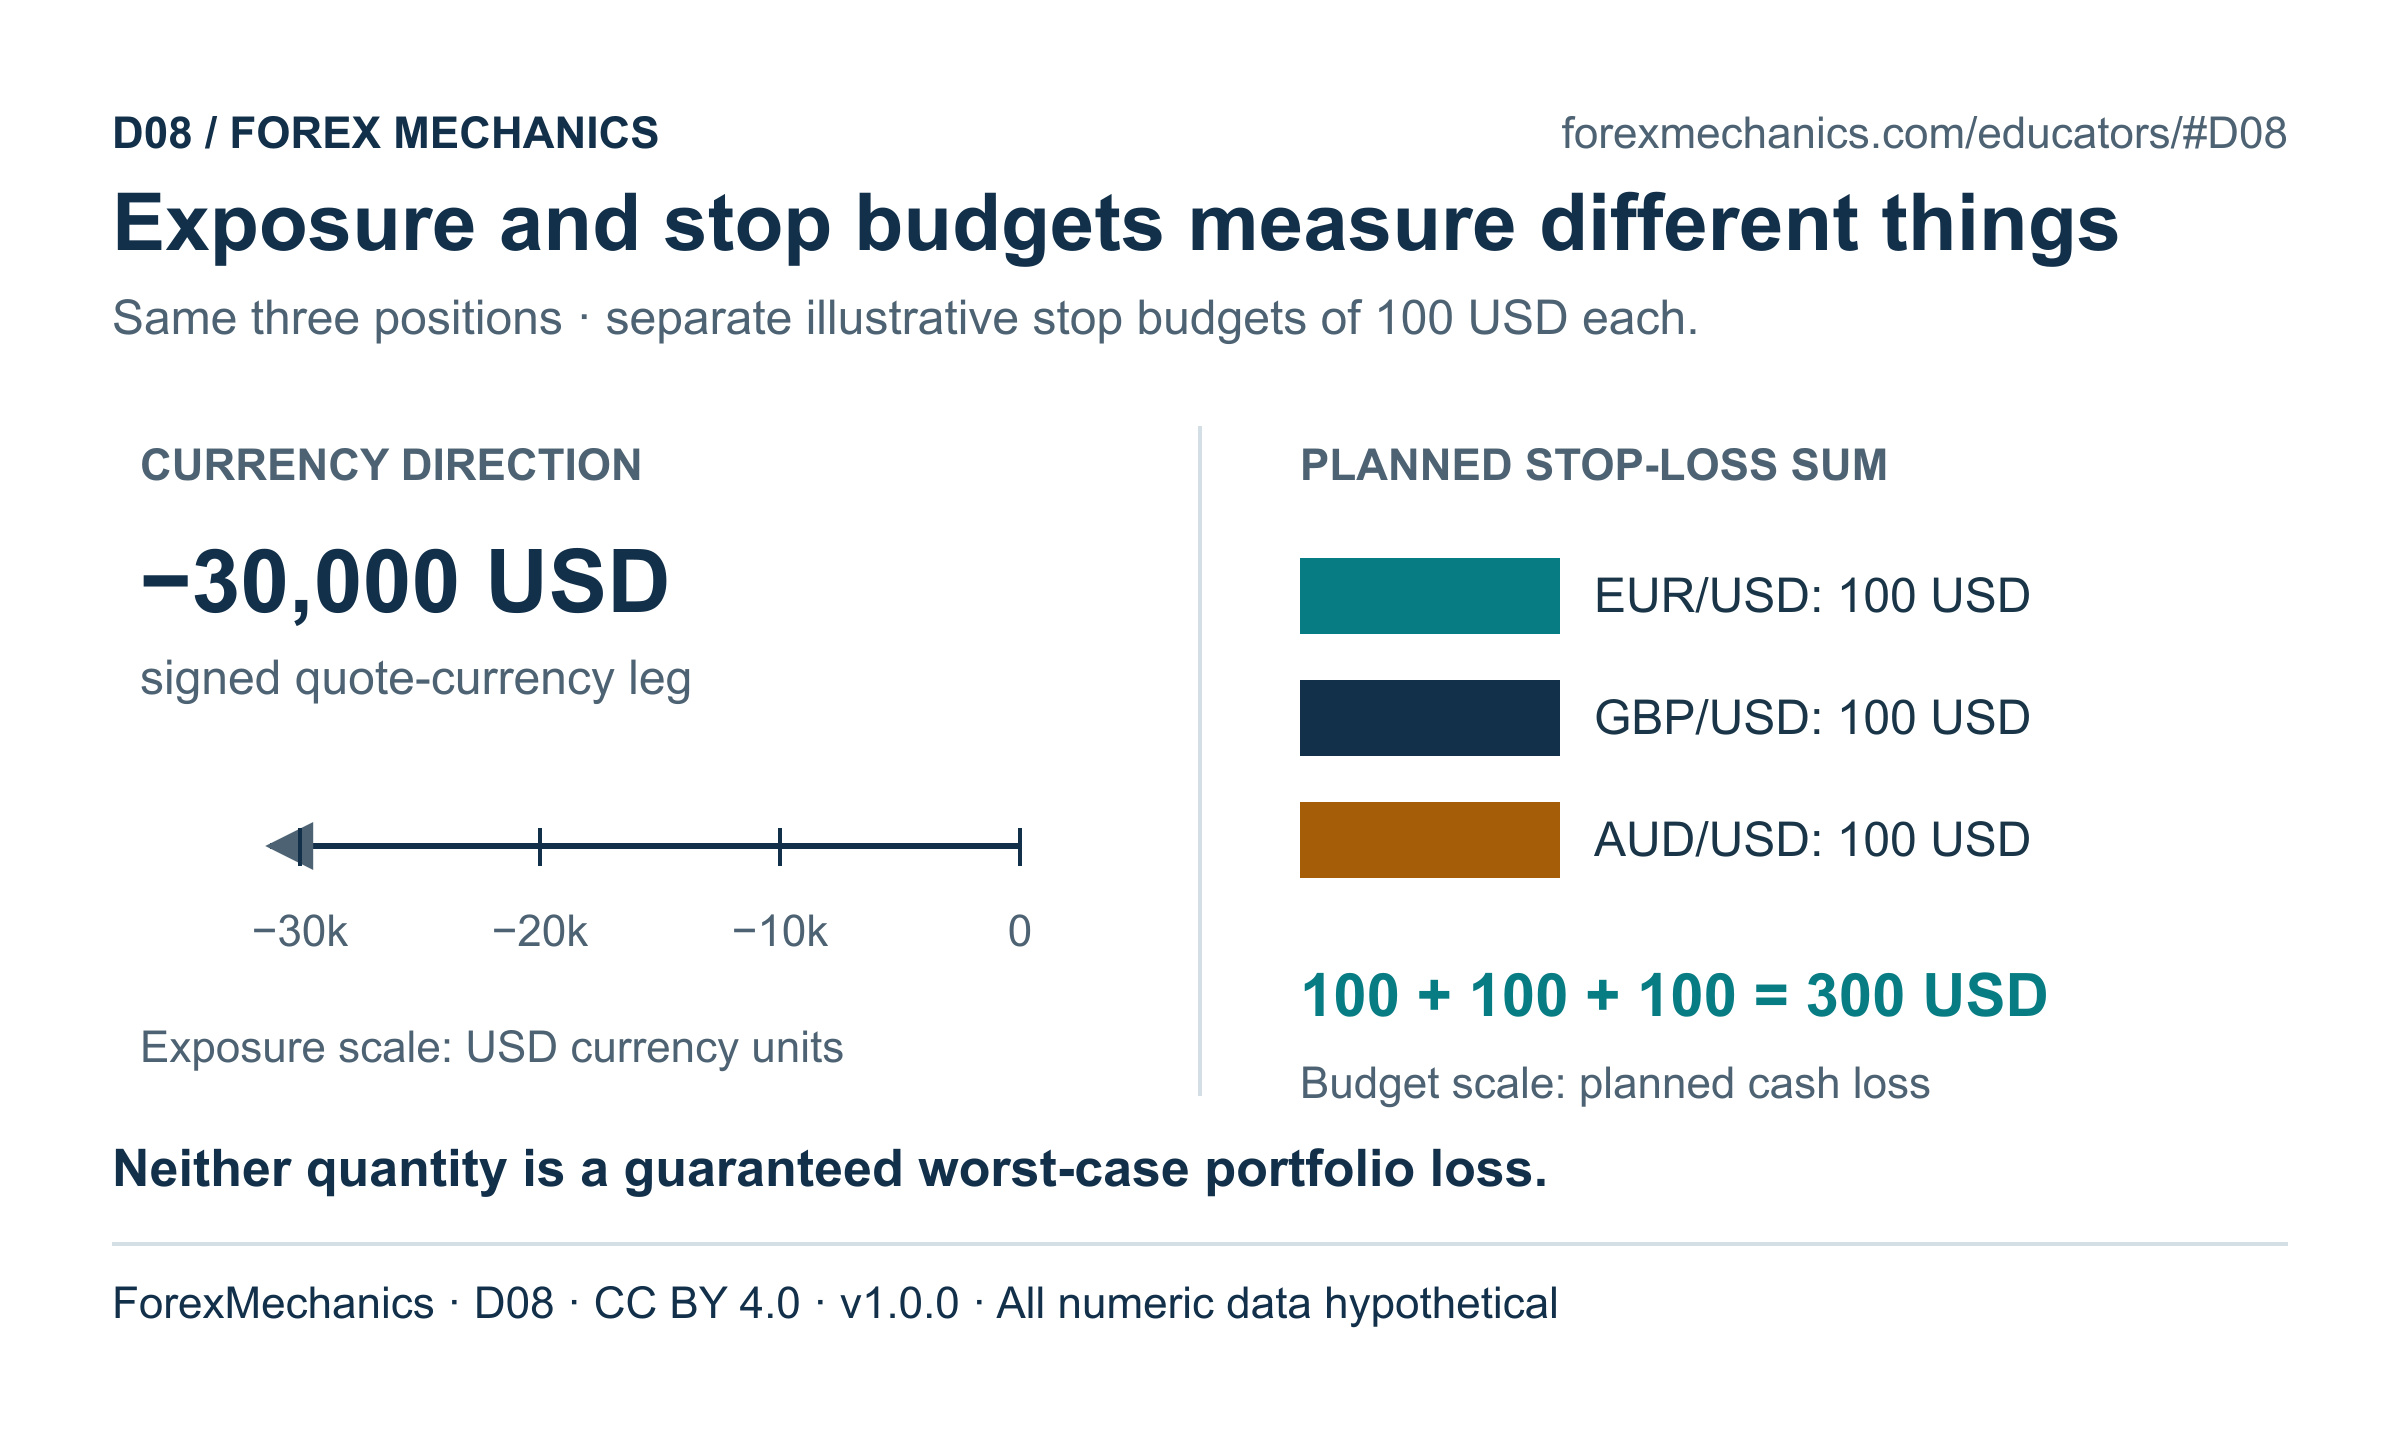
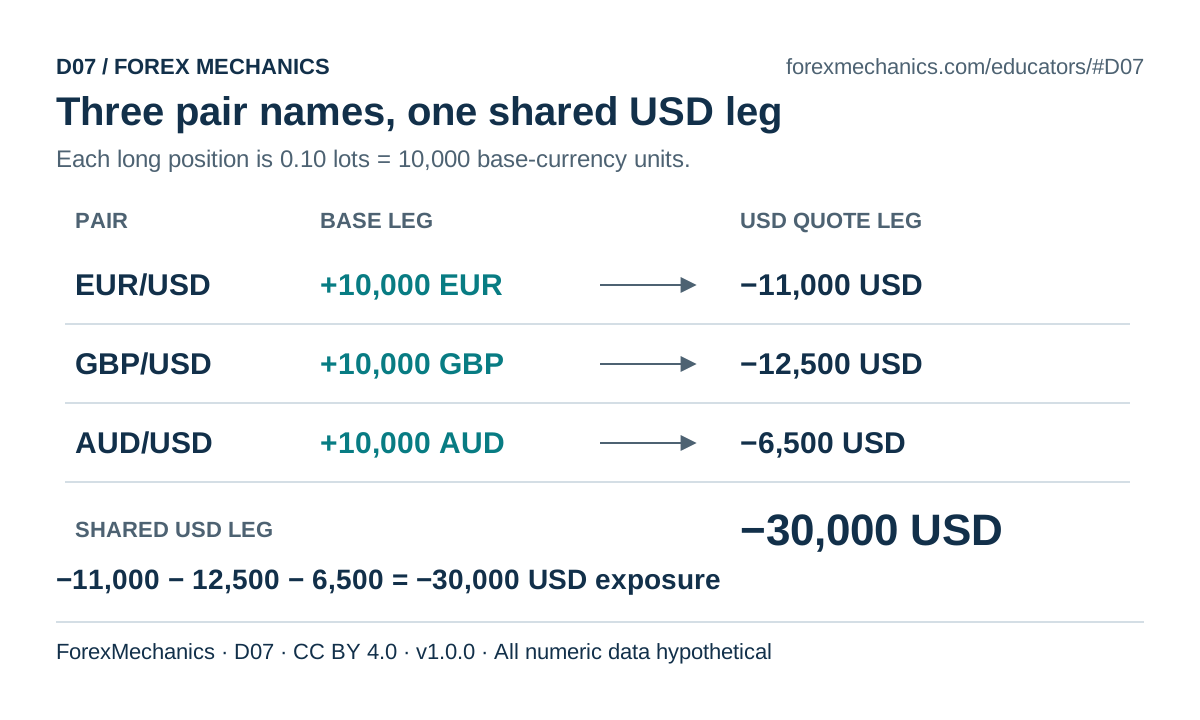
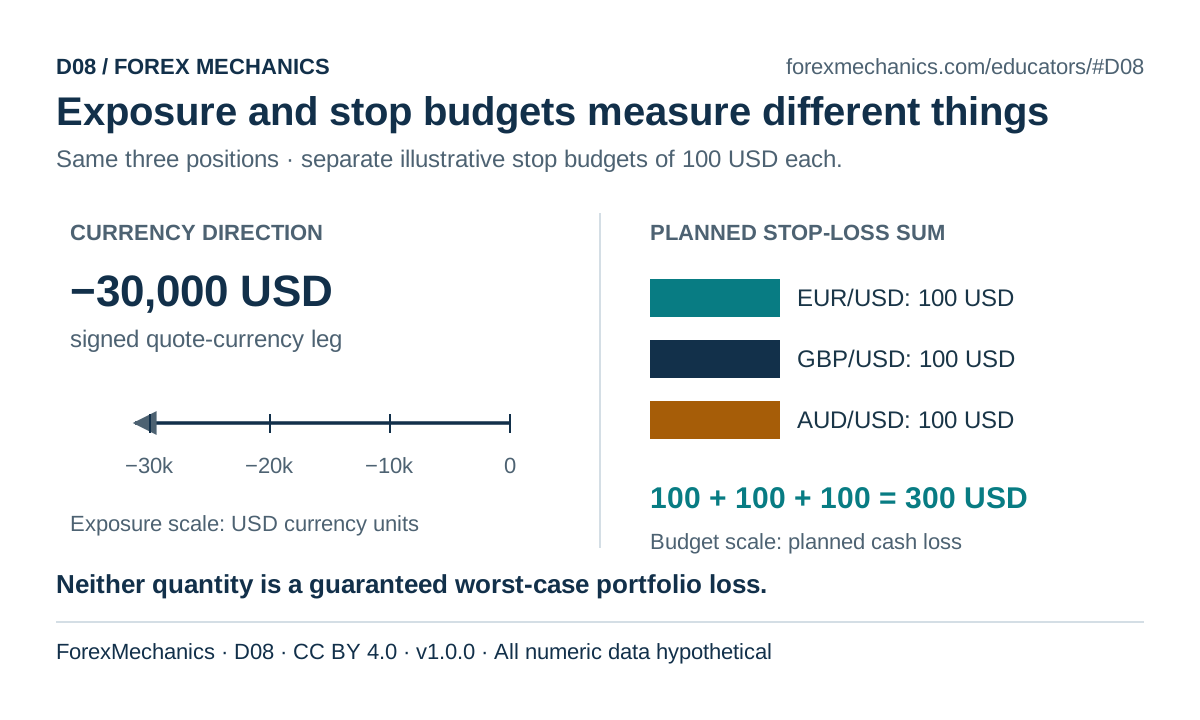
Use D07-D08 to represent the three supplied long base/USD positions. Keep exposure units separate from the stated 100 USD stop-loss budget for each position.
- 10 min - Exercise E03: find the common leg
Learners calculate and sum the negative USD legs, then separately sum planned stop-loss budgets. Check the usd-concentration case and inspect the same synthetic positions with the portfolio-exposure tool.
- 5 min - Keep one full-trade denominator
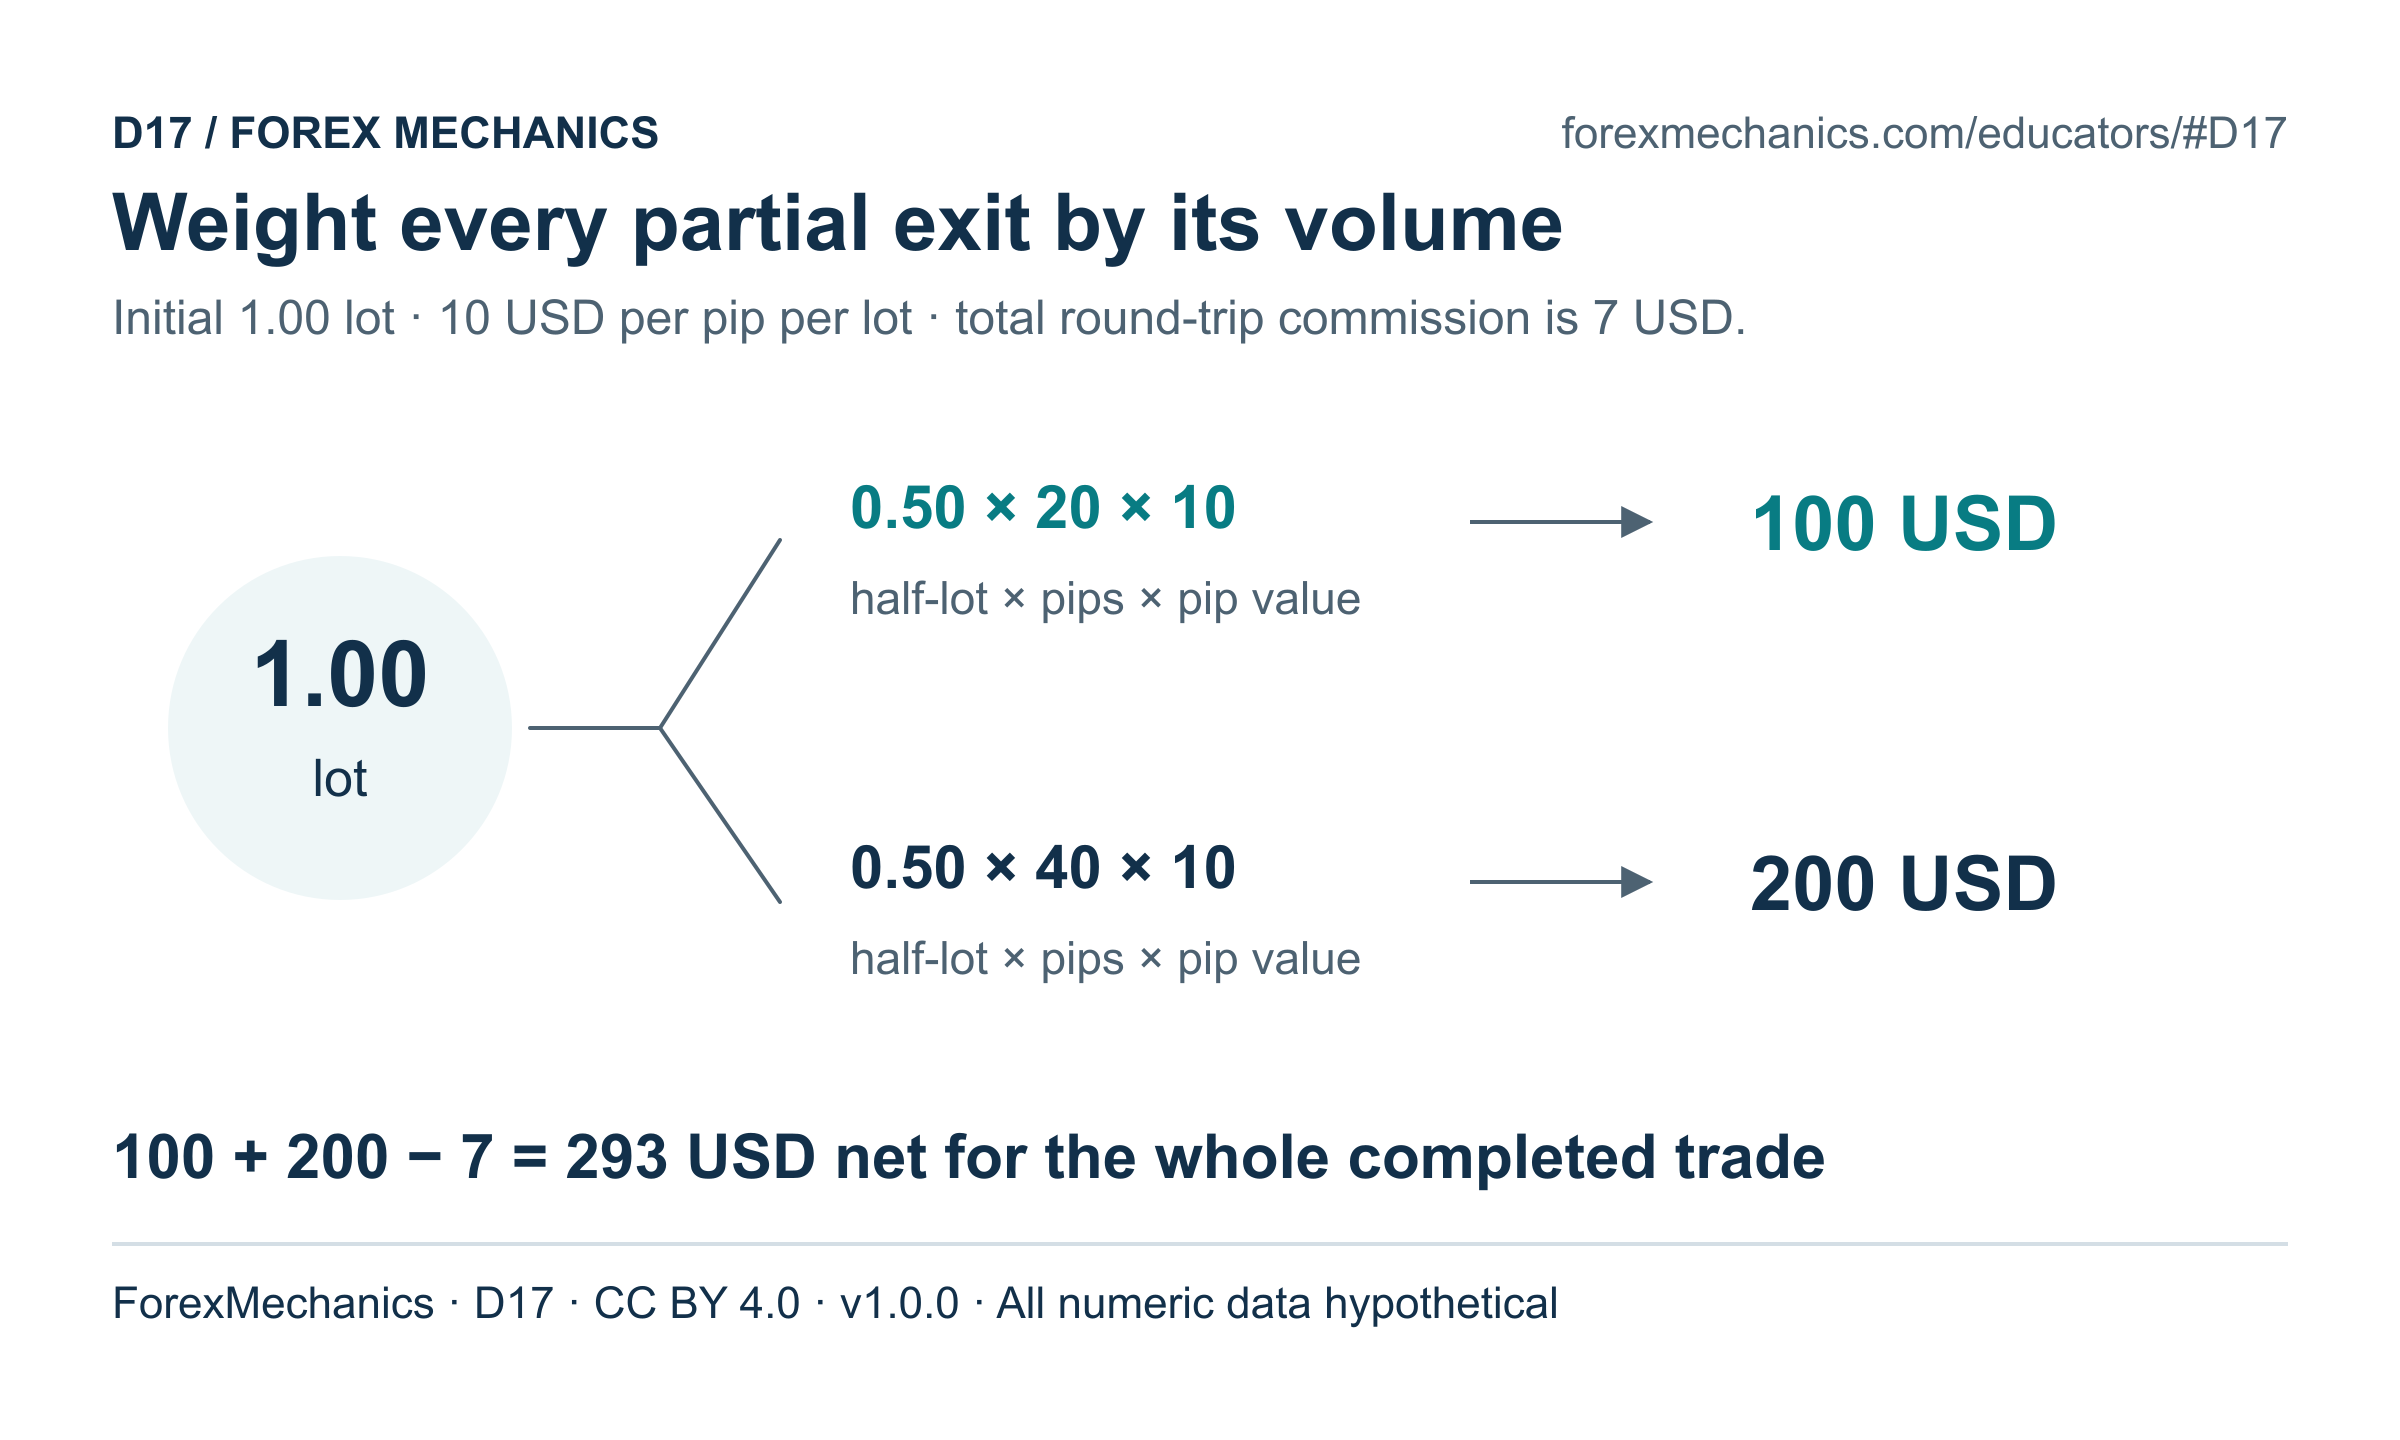
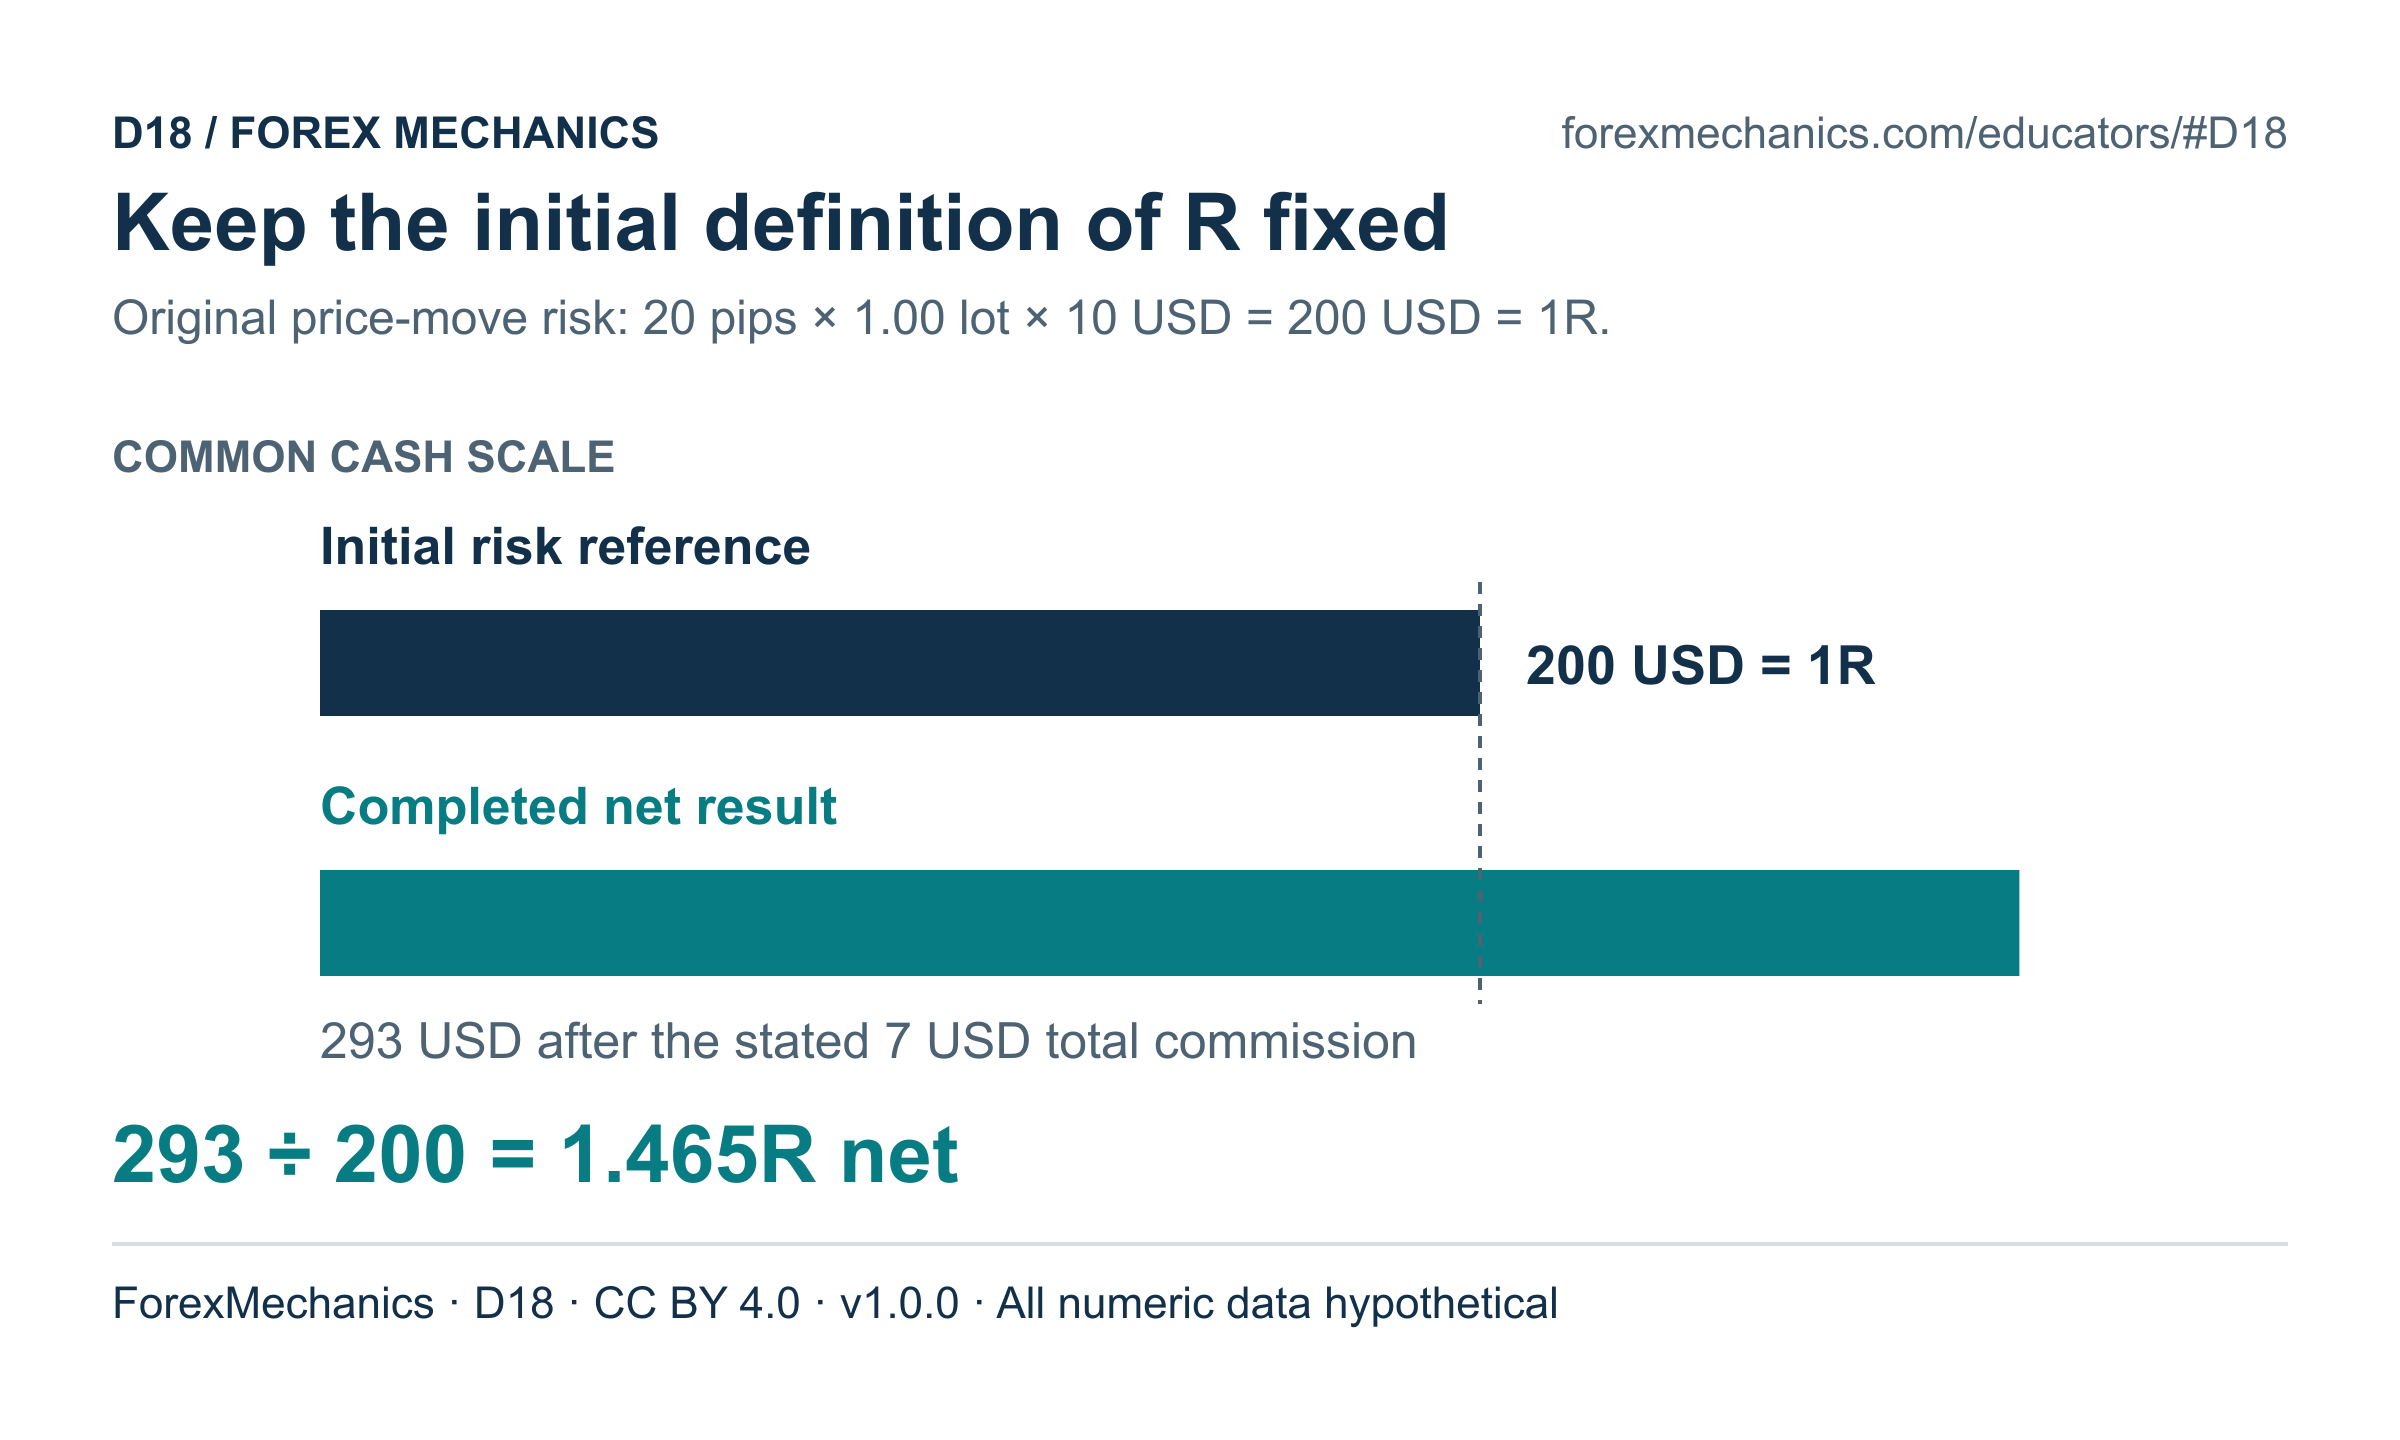
Use D17-D18 to draw the two exit volumes against the original 1.00-lot position. Keep the initial price-move risk of 200 USD as the stated denominator of R.
- 9 min - Exercise E09: combine the partial exits
Learners calculate each partial's gross cash result, add them, deduct the single full-trade commission and convert the total to R. Check the partial-exit case. If calculating each leg separately, reconcile costs across the whole trade rather than charging the full commission to each exit.
- 6 min - Reconcile and explain
Pairs review units, signs, volume weights and cost allocation. Finish with individual answers to the check questions.
Prices, volumes and outcomes are synthetic. A shared currency leg does not establish a correlation estimate or identical price behaviour. The exposure representation does not imply literal currency borrowing. The partial-exit calculation evaluates the supplied exits; it does not show that partial exits improve a strategy.
L04 · 40 MINUTES
Drawdown: the path and the recovery denominator
- Track a running equity peak and calculate subsequent percentage drawdown from that peak.
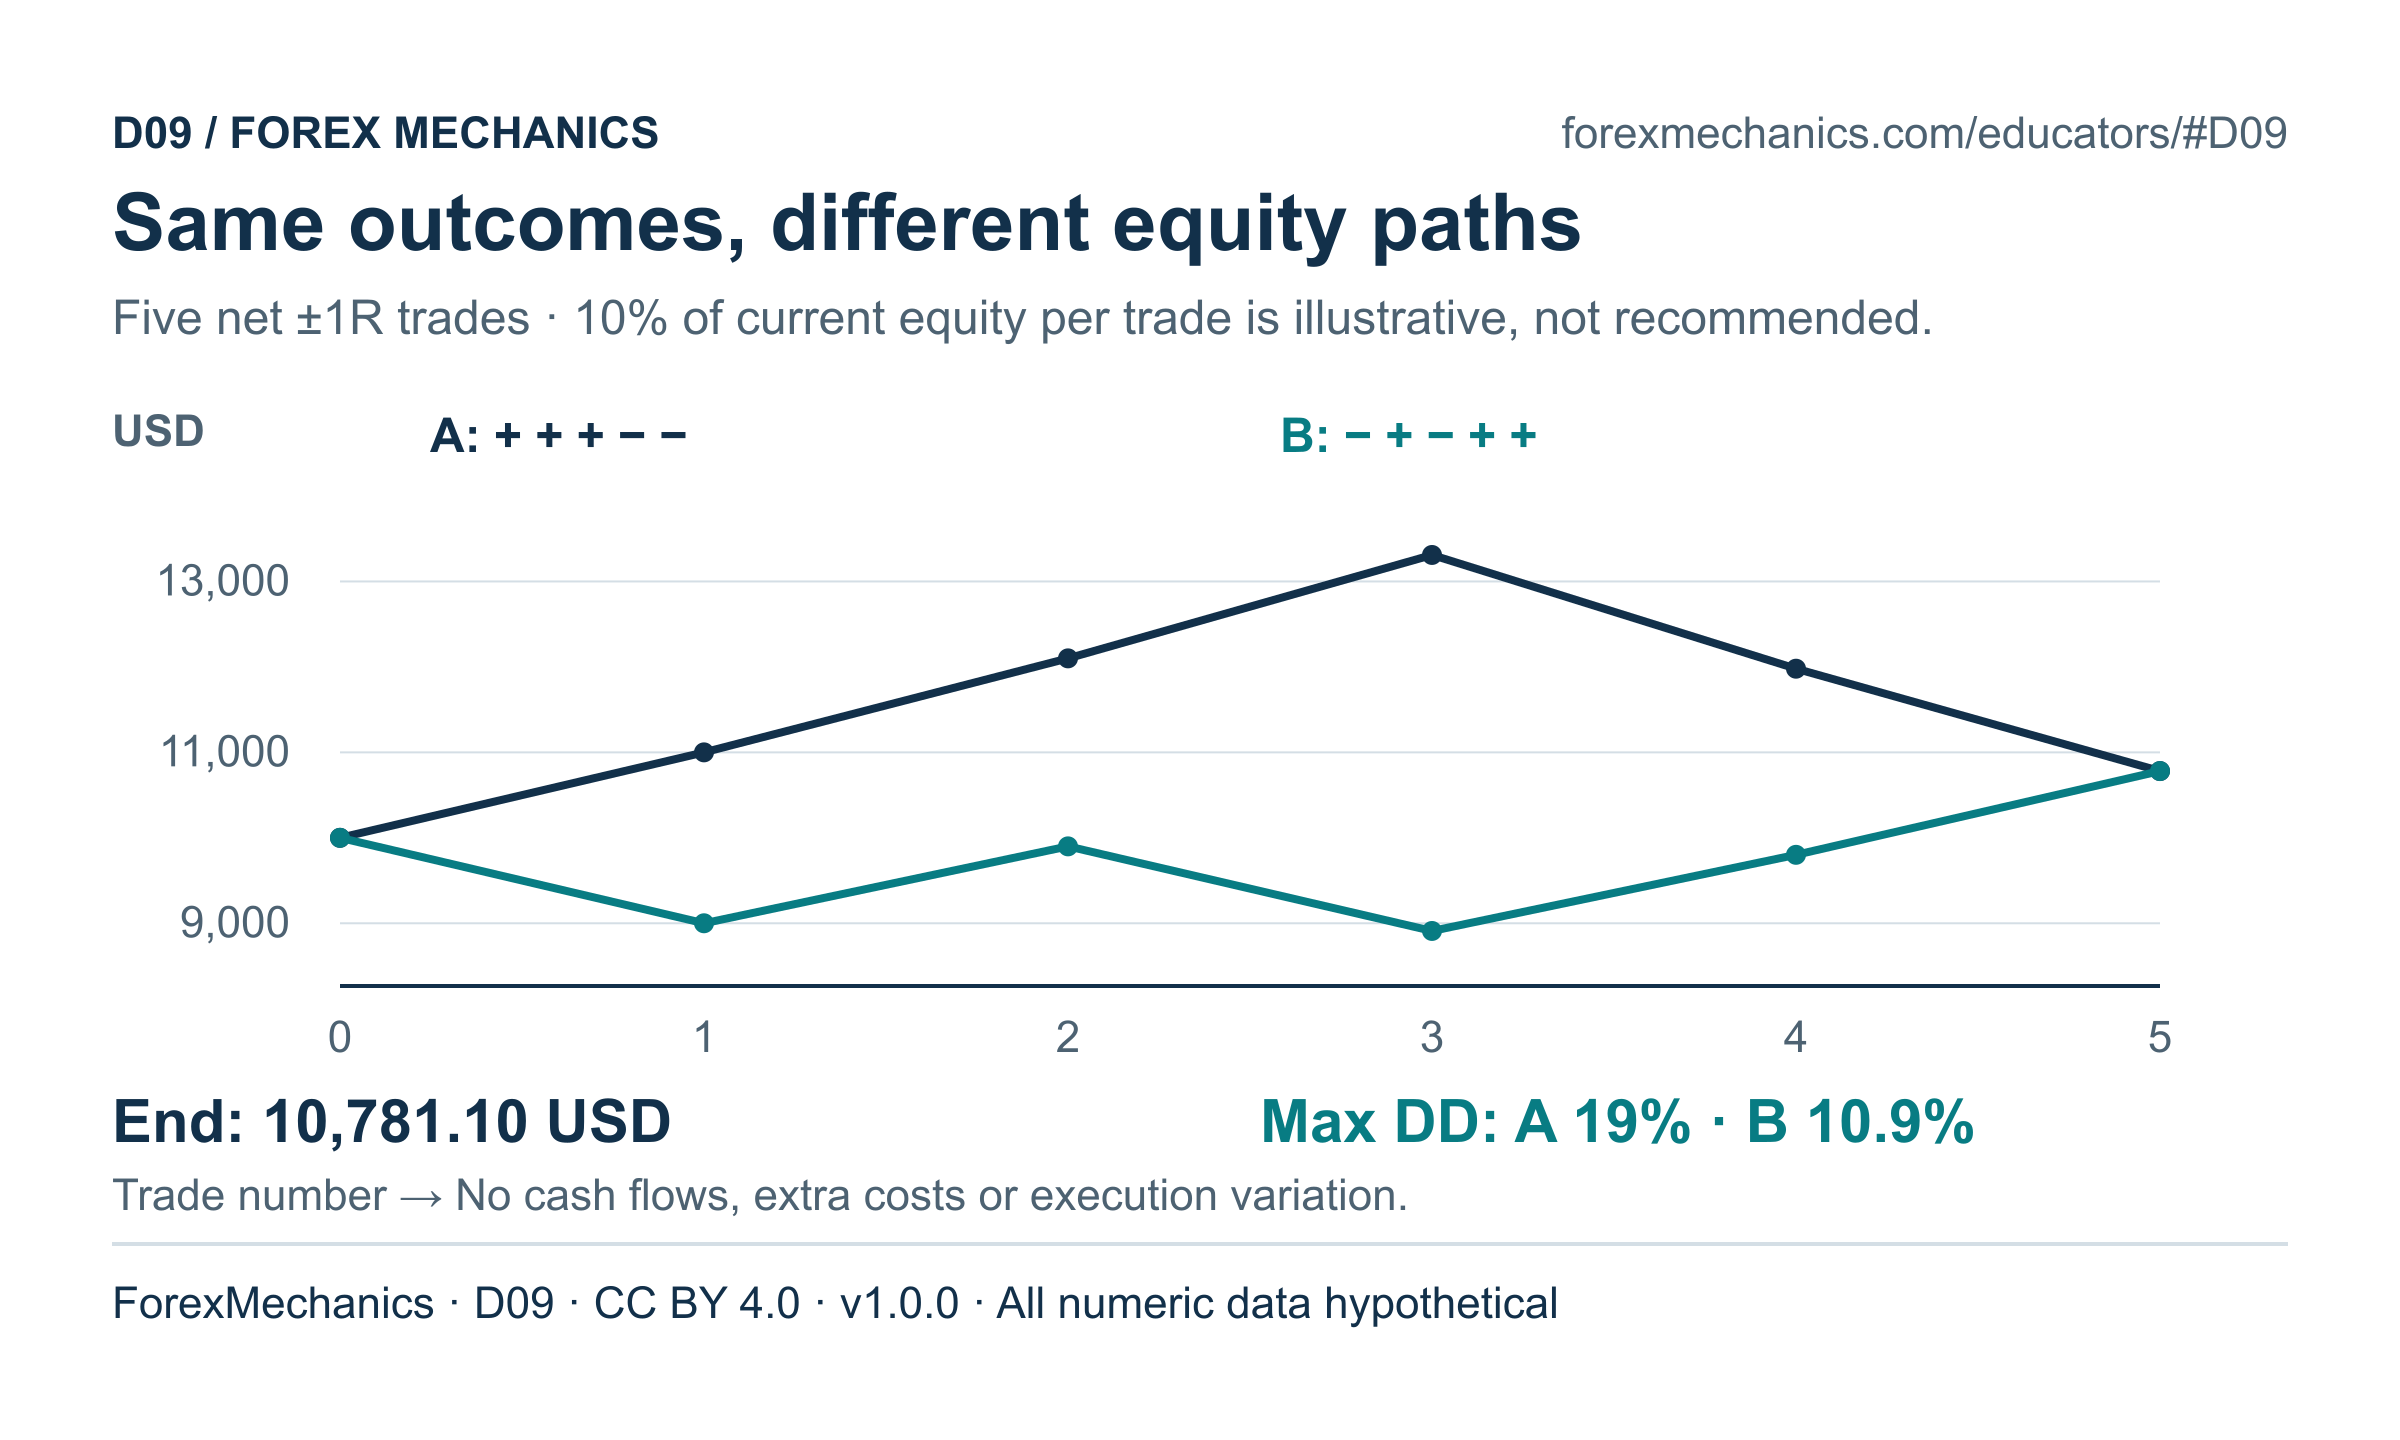
- Explain why the same supplied outcomes can have the same final equity and different drawdown paths.
- Calculate the gain needed to restore a starting amount after a loss, using remaining capital as the denominator.
View lesson sequence
- 4 min - Predict before calculating
Show E04's two sequences. Learners predict whether final equity and maximum drawdown must be identical, recording the predictions separately.
- 6 min - Introduce the running peak
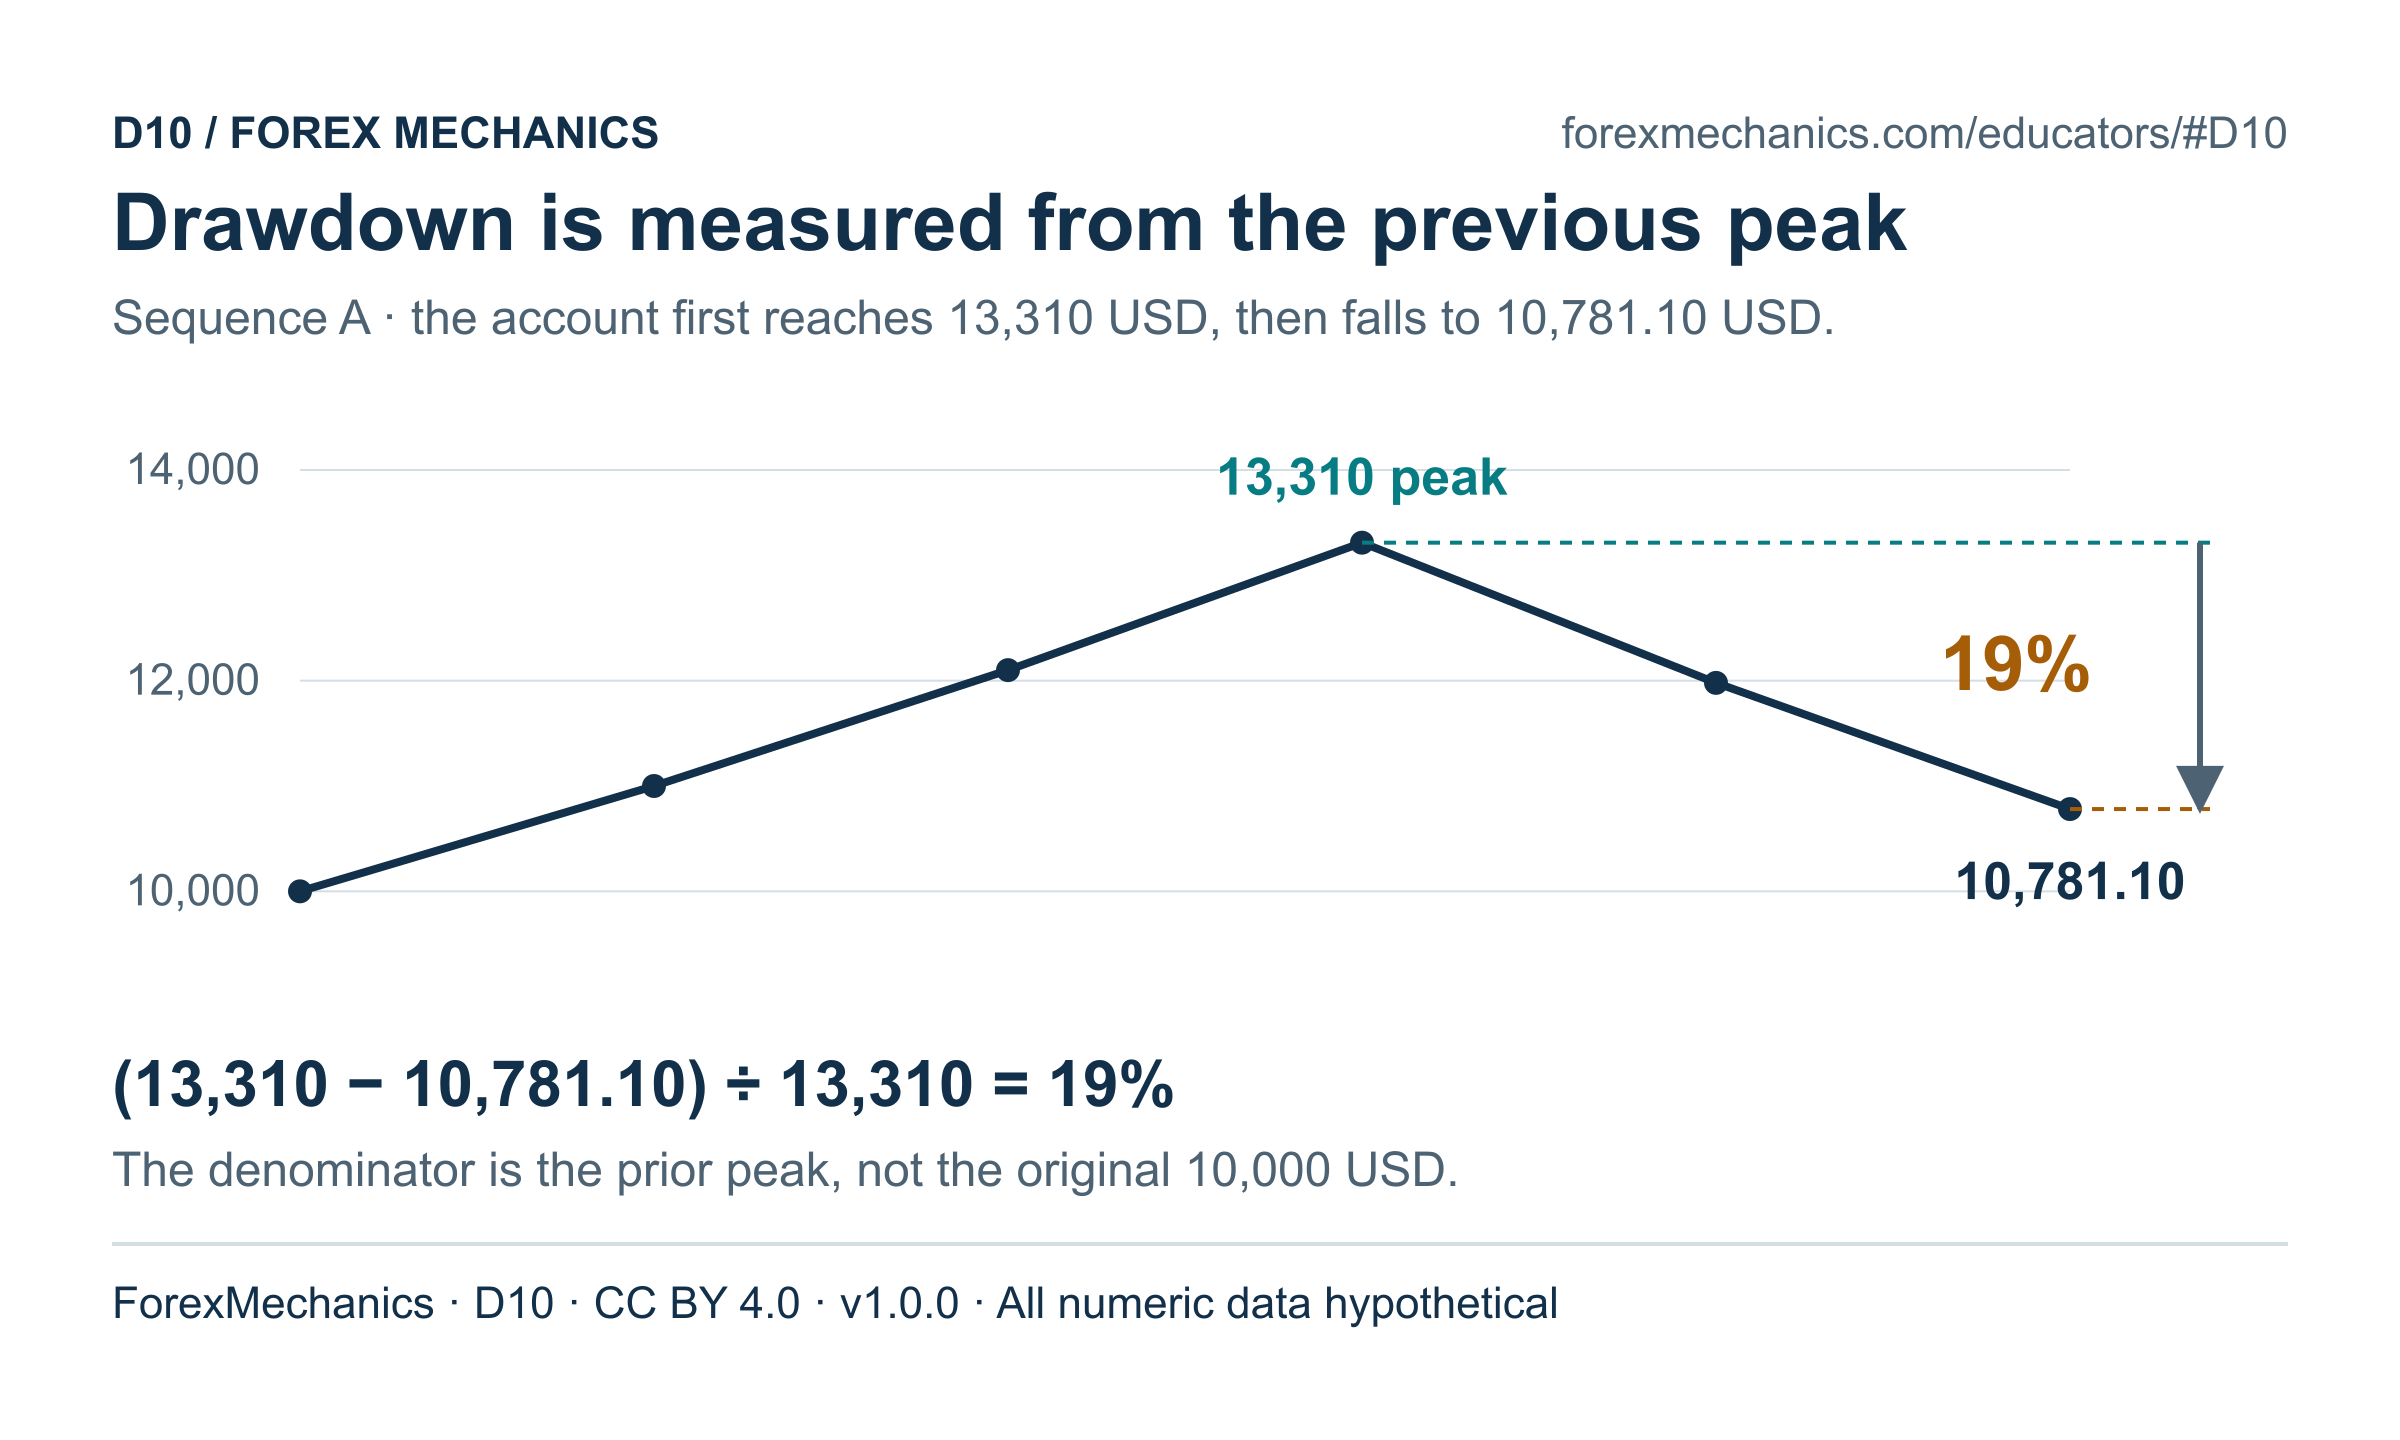
Use D09-D10 to demonstrate one row of the equity table and identify the drawdown denominator. Explain that profit relative to initial capital can coexist with a drawdown from a later peak.
- 10 min - Exercise E04: calculate the path
Learners complete sequence A's table and find maximum drawdown. Compare its path with sequence B before checking the backtest-sequence case. Discuss what conditional resampling can illustrate and what fresh evidence it cannot create.
- 5 min - Change the recovery denominator
Use D16 to distinguish a loss measured against starting capital from a gain measured against remaining capital. Learners identify the two denominators before applying a formula.
- 9 min - Exercise E08: restore the starting amount
Learners calculate the gain required after the supplied 25% loss, then verify it in the drawdown-recovery case and drawdown calculator. Explain why the arithmetic says nothing about how quickly that gain could be earned.
- 6 min - Individual exit check
Use the check questions. Each learner gives one reason a reassuring final return is an incomplete description of the path. Do not turn the example into a recommended position-risk setting.
Paths and recovery inputs are synthetic, with no cash flows or execution variation. The 10% risk fraction makes the arithmetic visible; it is not a safe or recommended threshold. Resampling is conditional on its observations and model. It does not establish future drawdown, ruin probability or the attainability of a recovery return.
L05 · 40 MINUTES
Evidence before conclusions: journals and holdout tests
- Select unique completed trades with valid realised net outcomes before calculating a journal statistic.
- Keep planned targets separate from realised results and document an explicitly known duplicate.
- Distinguish a selected training result from a frozen-rule holdout result and state the limits of a five-trade sample.
View lesson sequence
- 4 min - Define the sample
Ask whether five rows necessarily mean five completed trades. Learners write an inclusion rule before inspecting the E05 records.
- 6 min - Audit the records
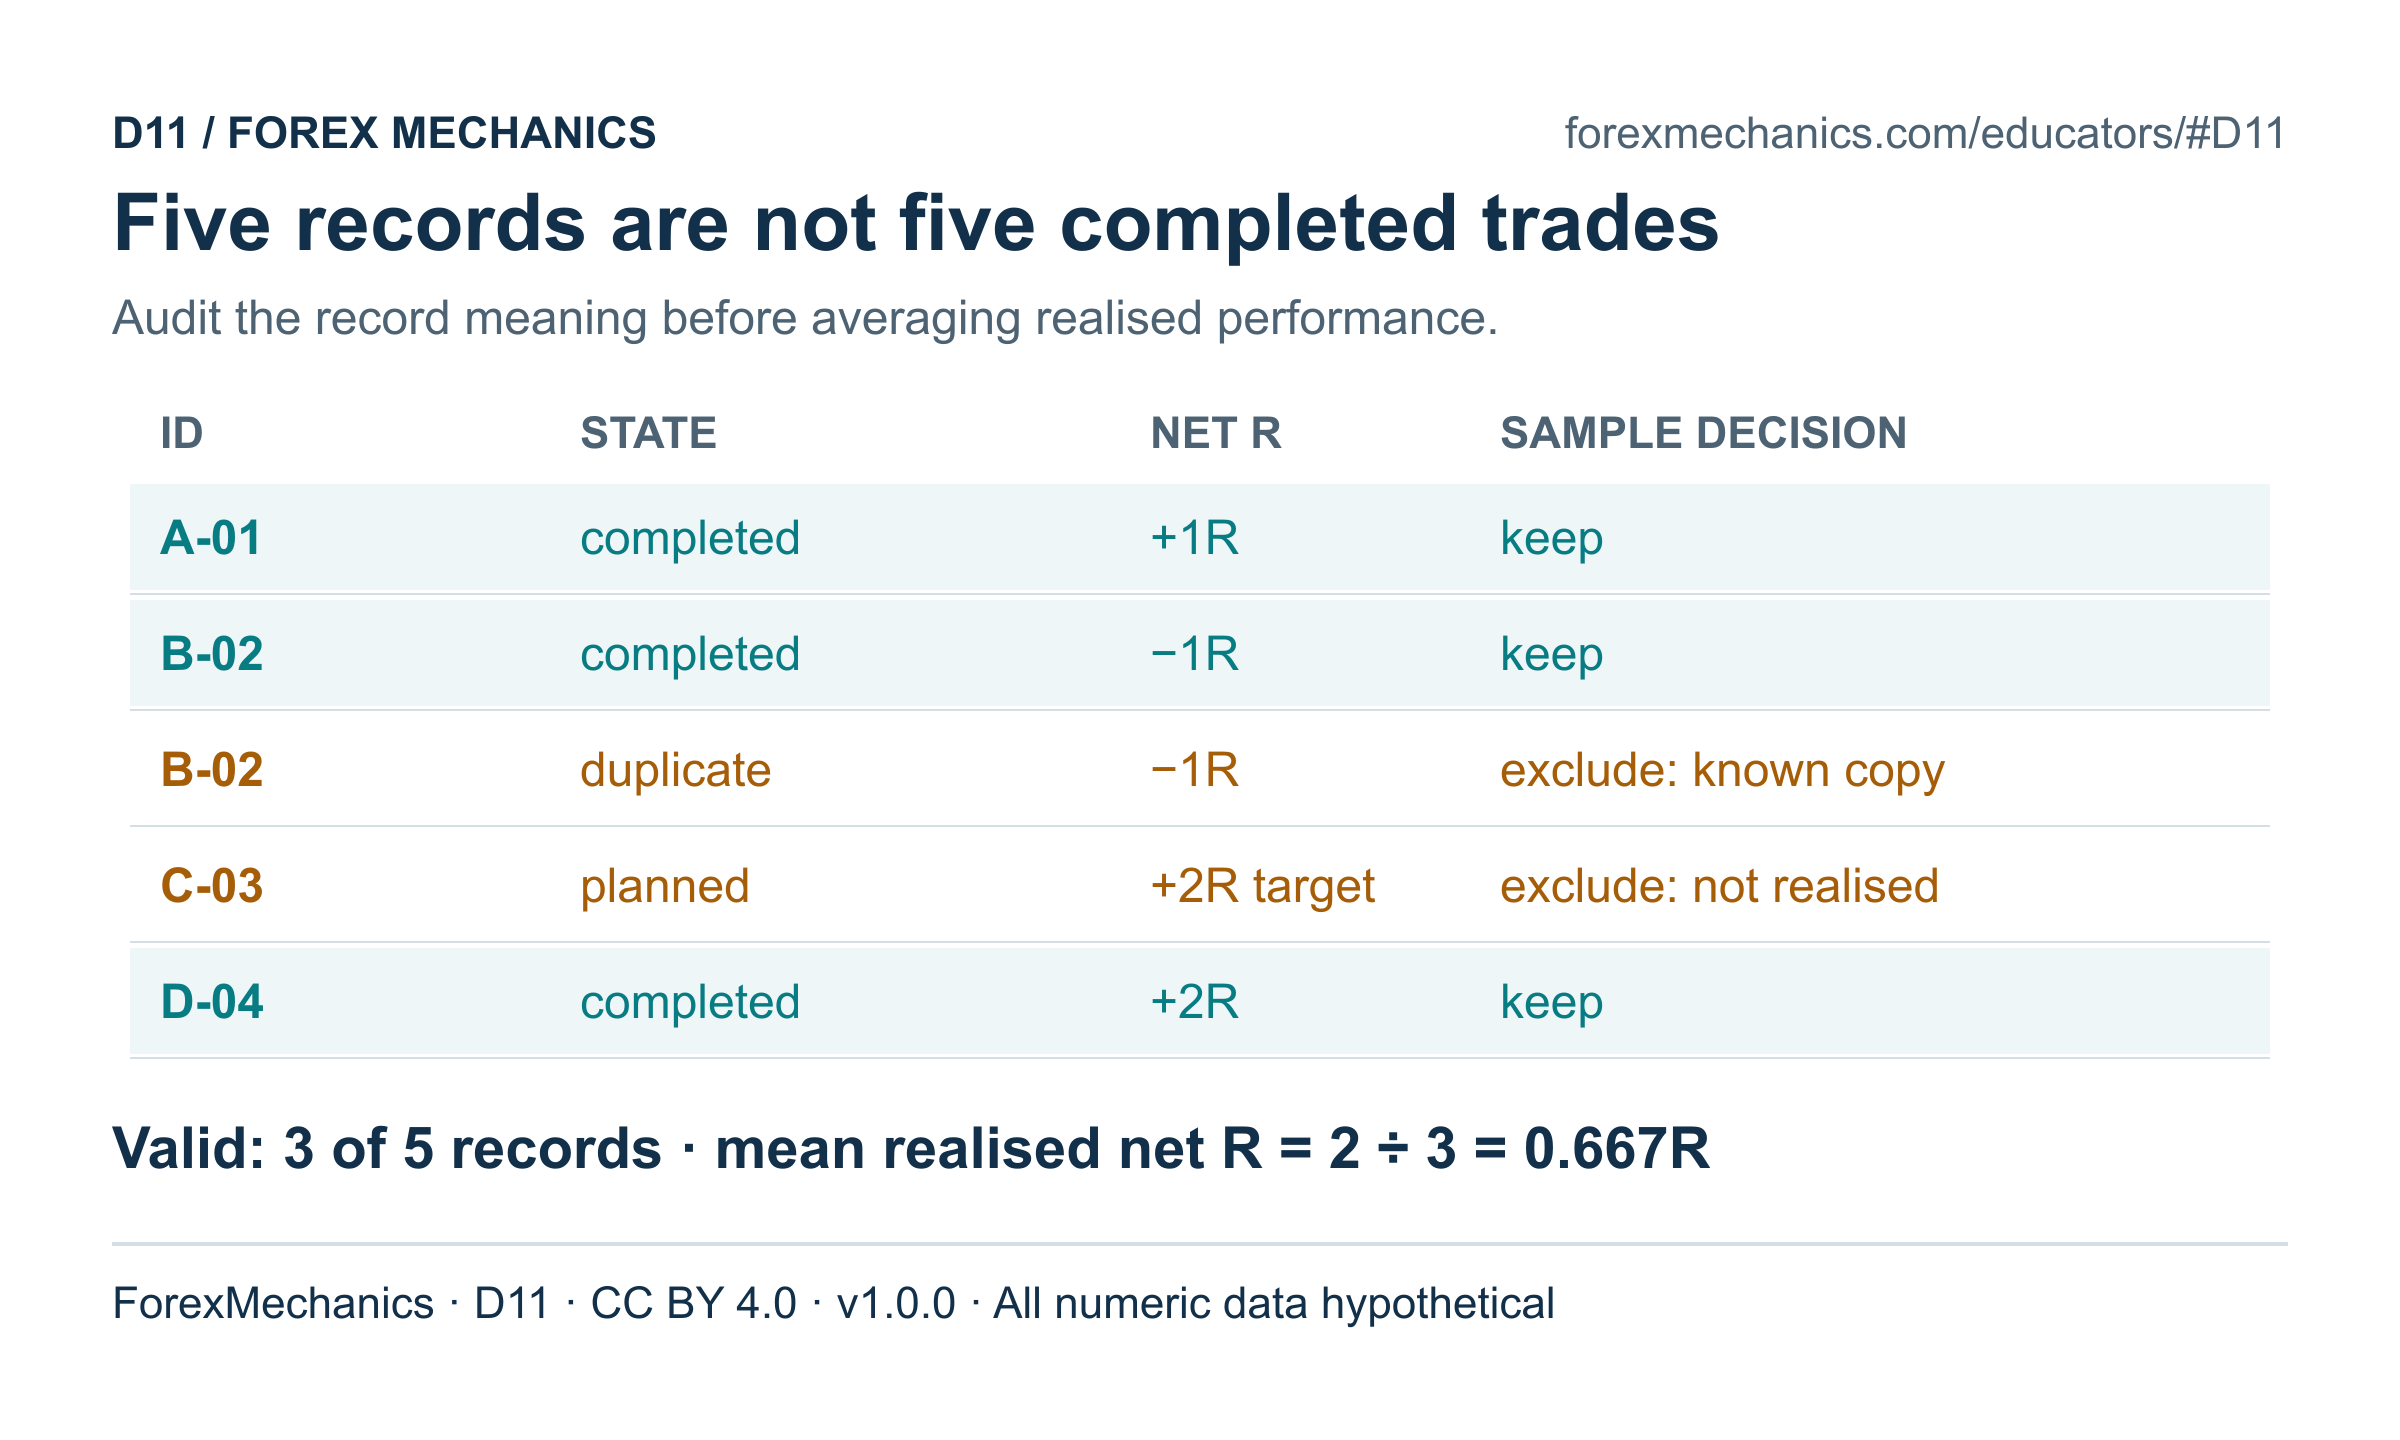
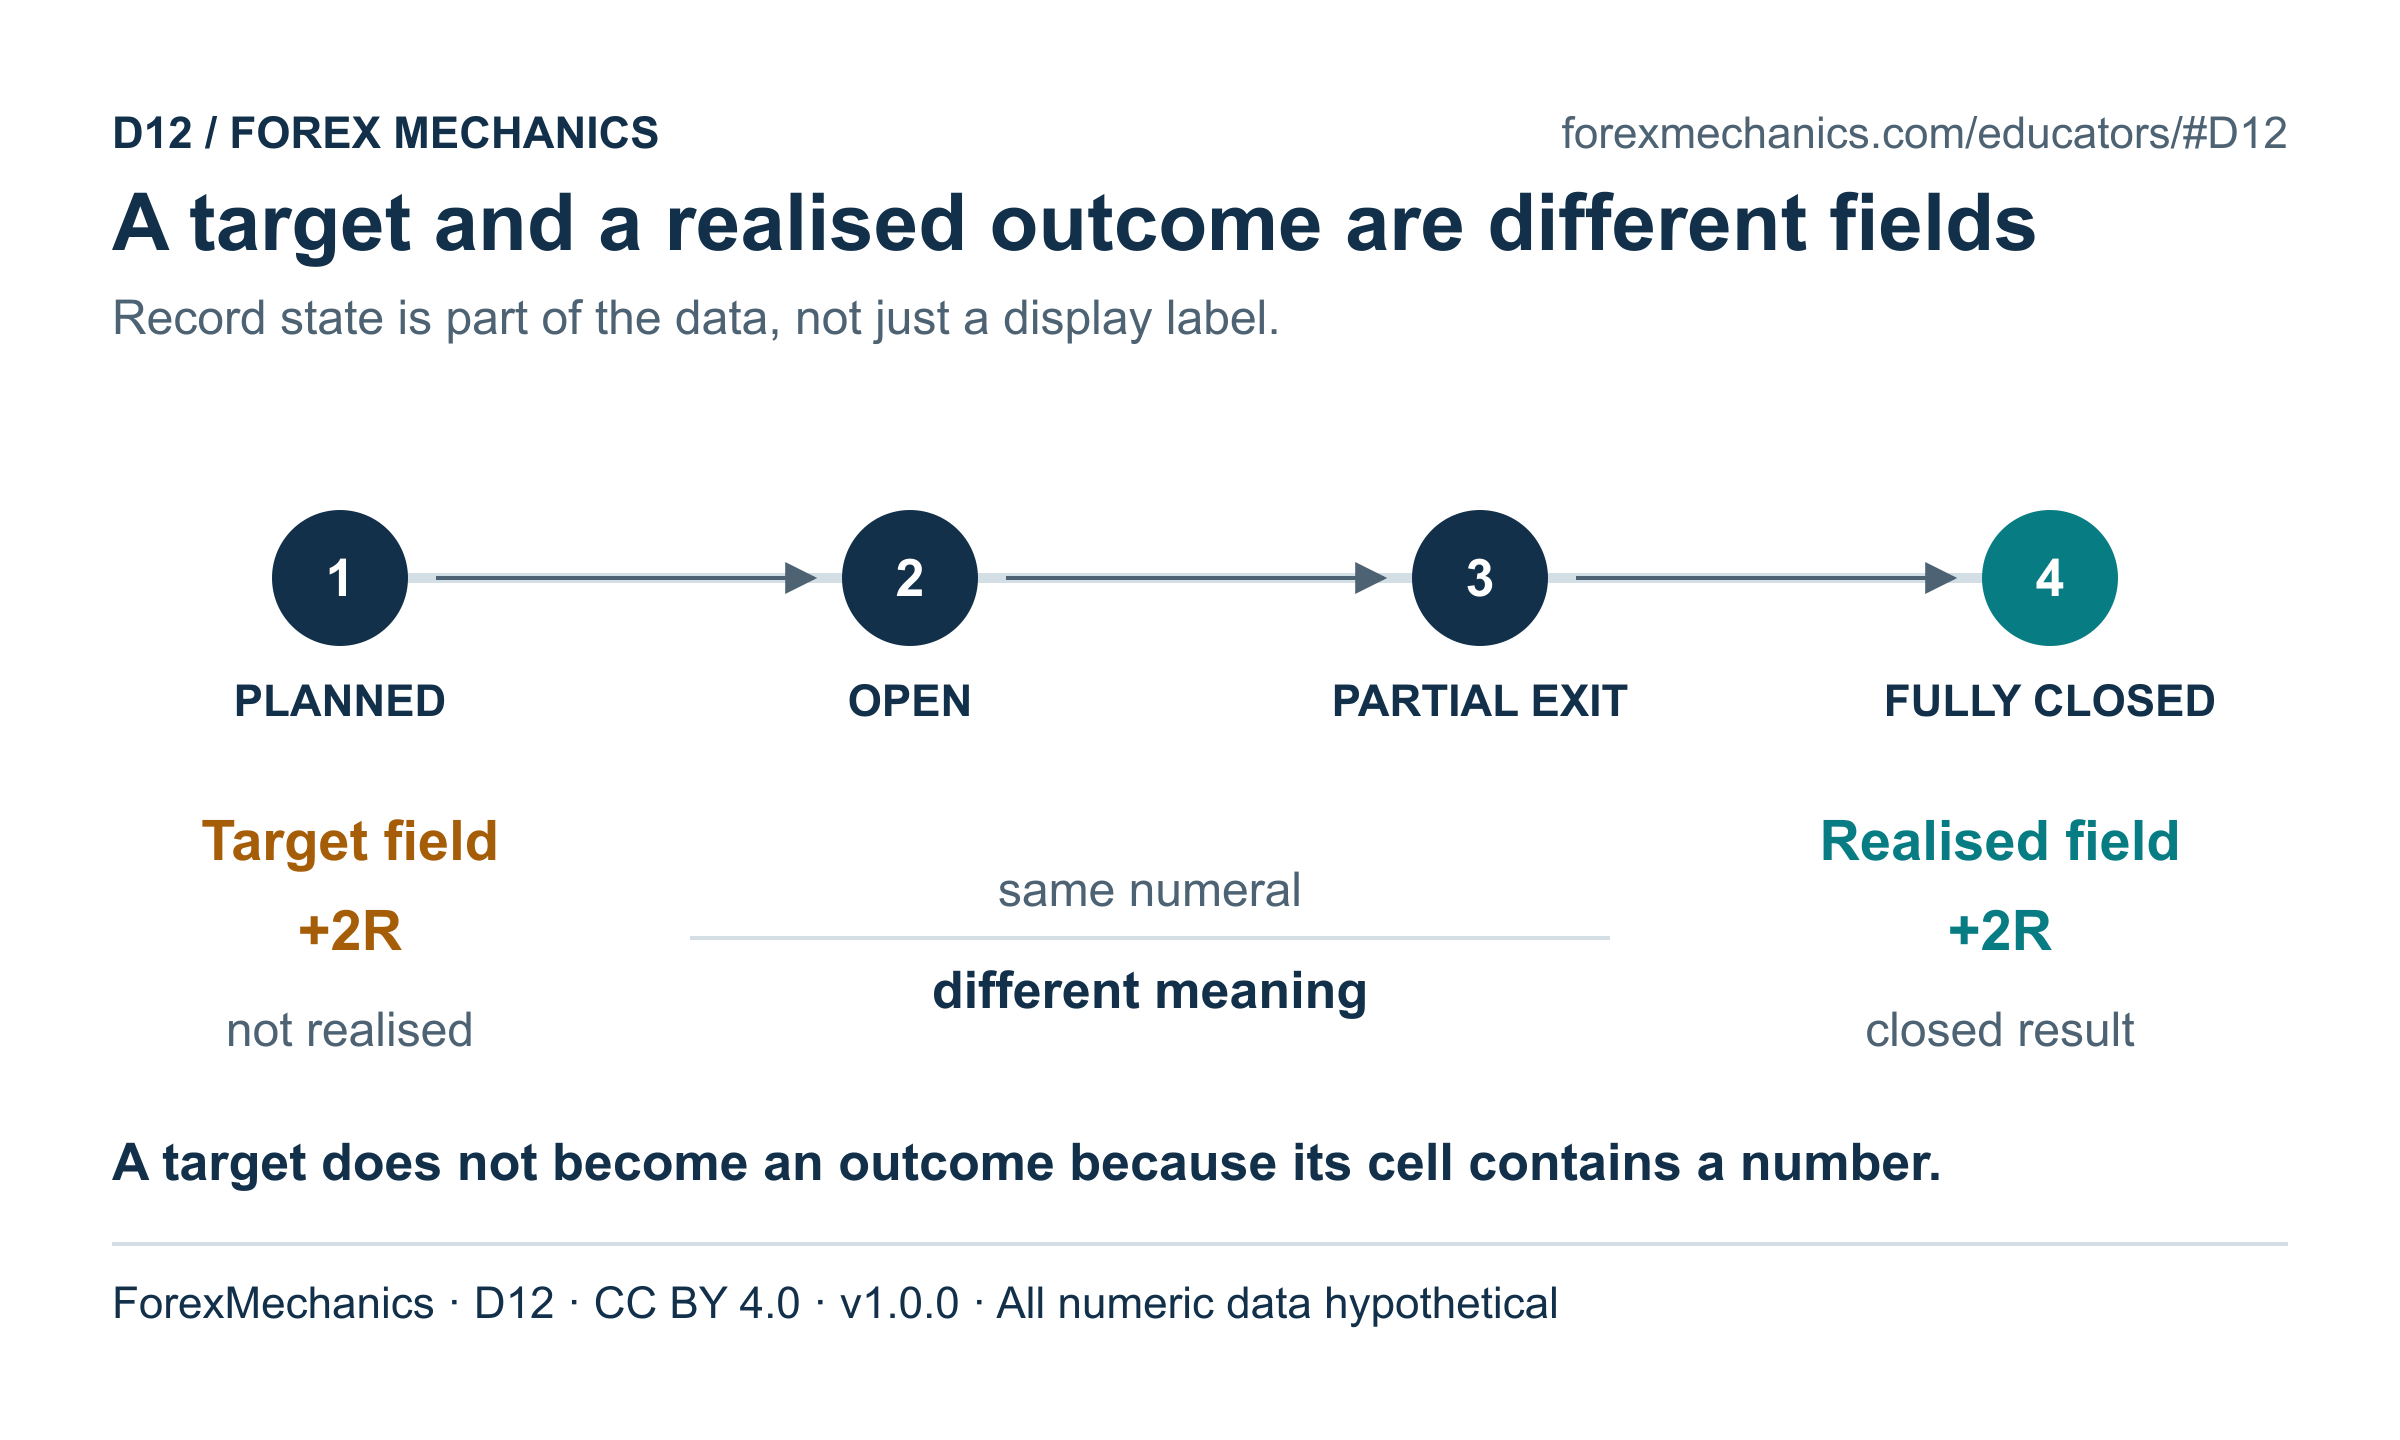
Use D11-D12 to separate plans, completed outcomes and the explicitly known accidental duplicate. Require a reason for each inclusion or exclusion; do not remove an inconvenient losing trade.
- 9 min - Exercise E05: compute a defensible mean
Learners select unique completed trades, report sample size and calculate mean realised net R. Check the journal-quality case. If demonstrating the journal analyzer, first reconcile the file with the worksheet and stated inclusion rule.
- 6 min - Separate selection from evaluation
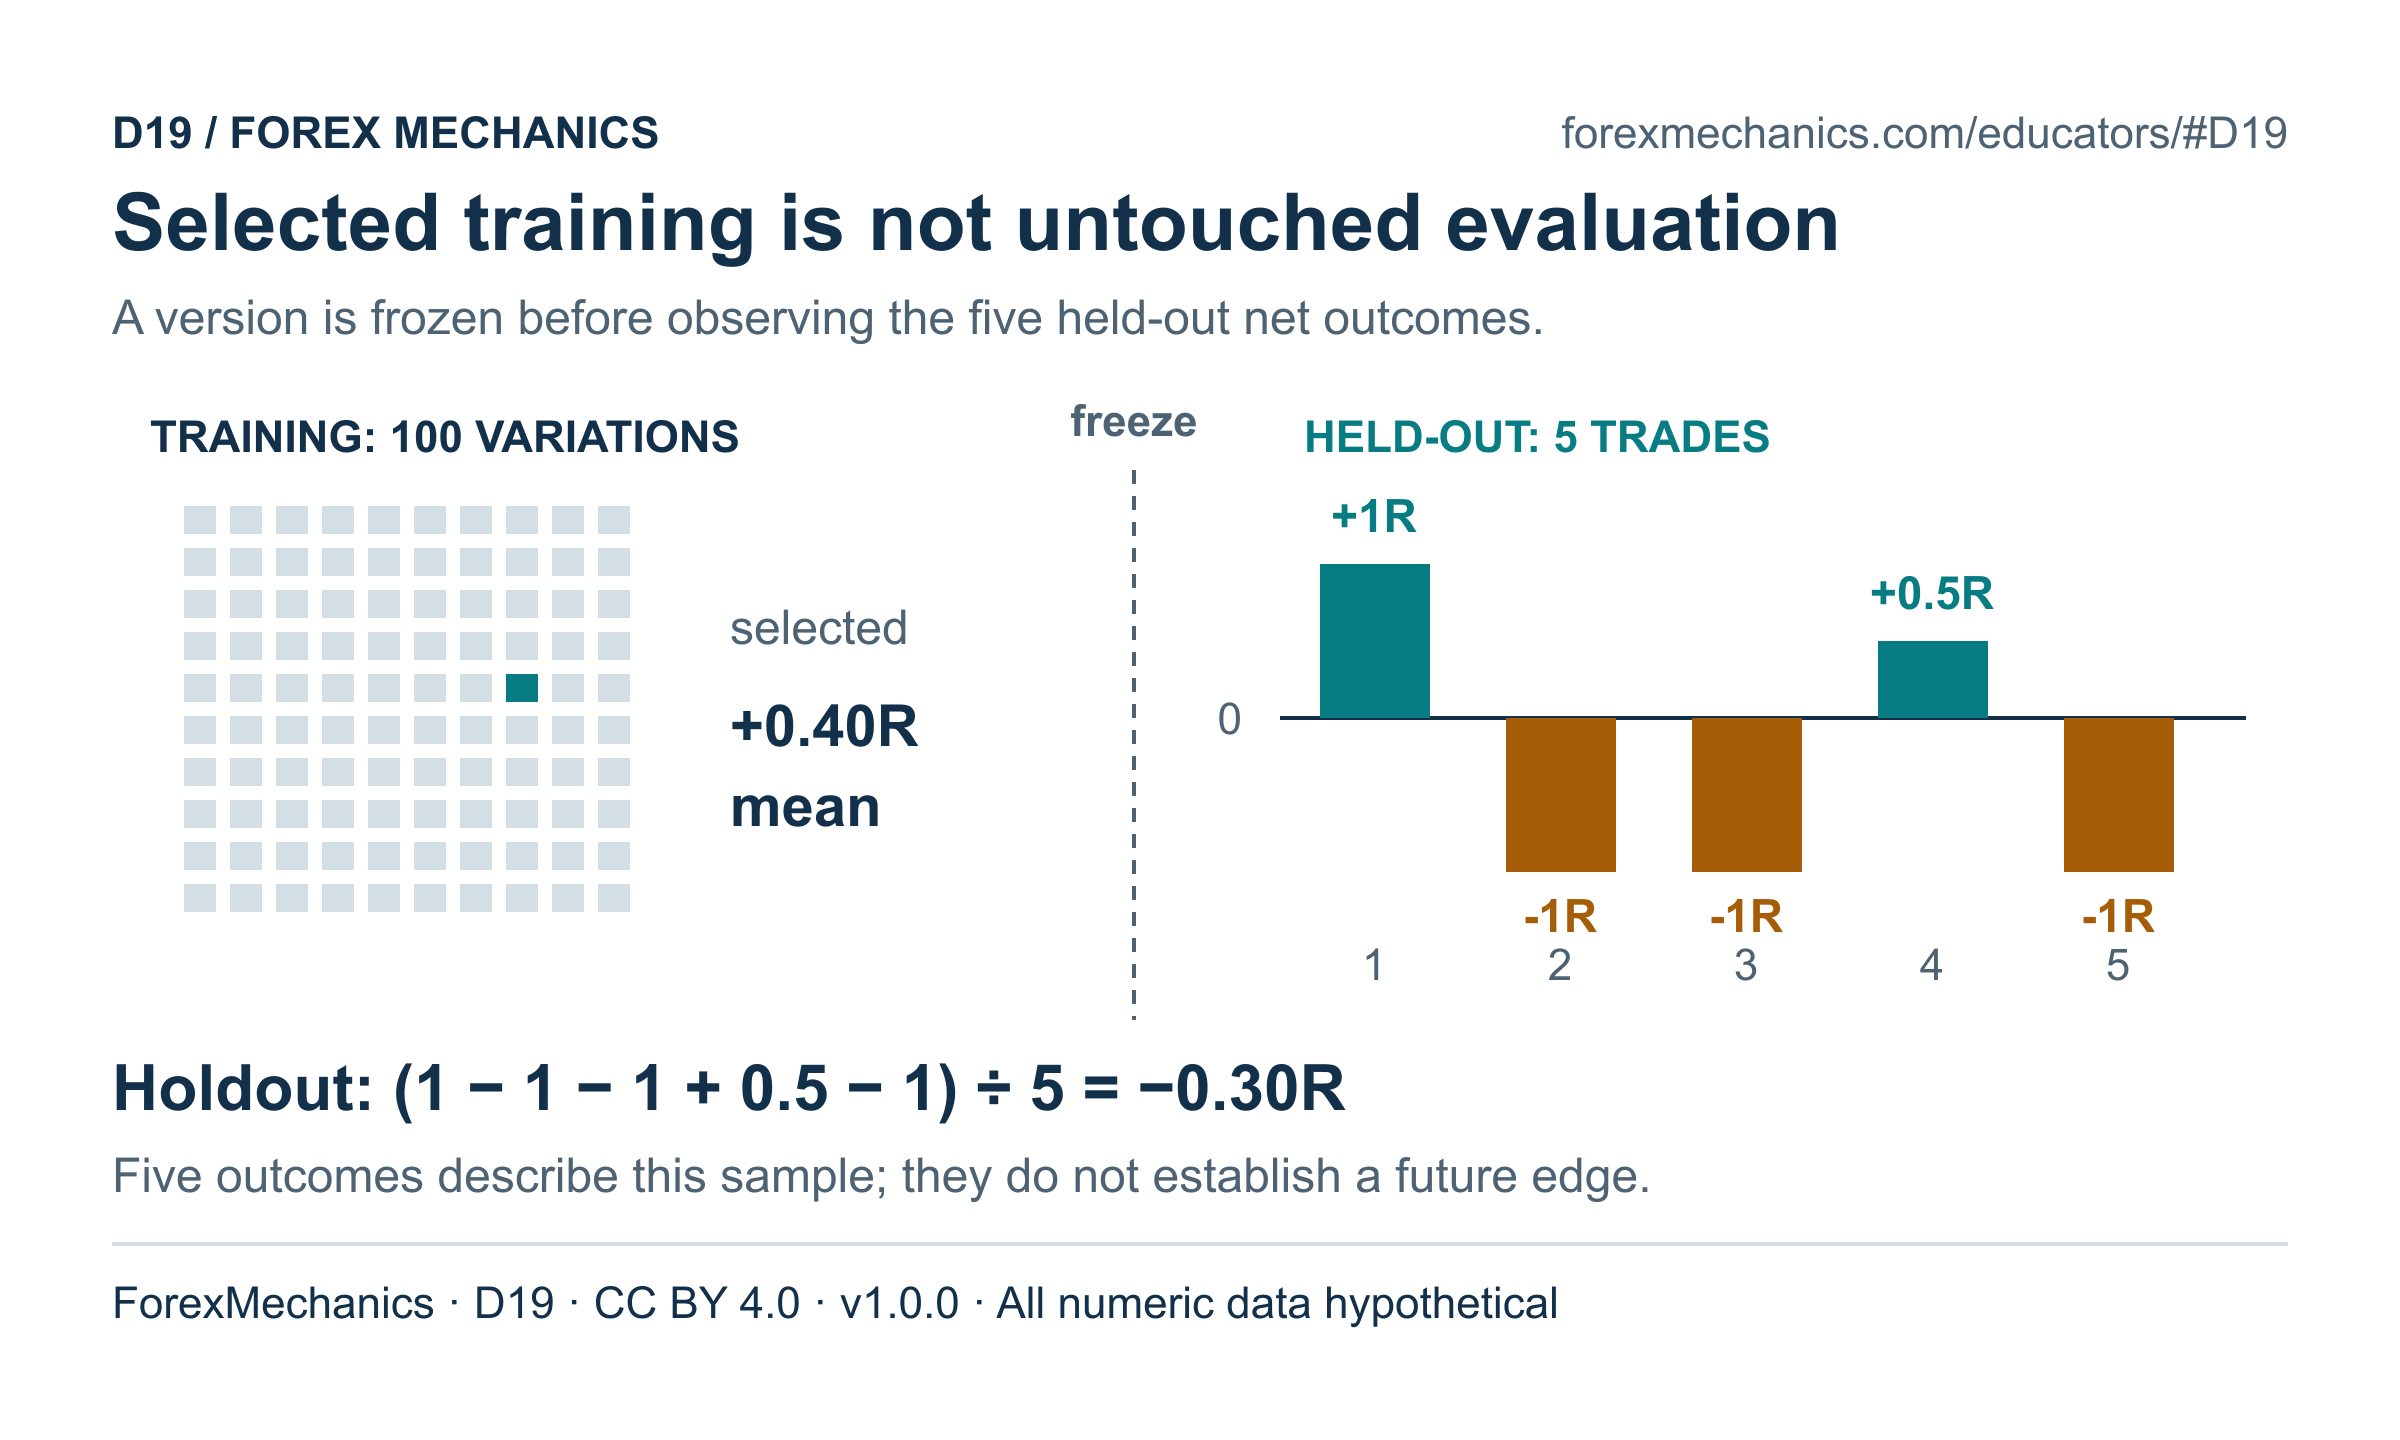
Use D19 to distinguish searching 100 training variations from evaluating one version frozen before the holdout observations. Ask what happens to the test's role if rules change after its results are seen.
- 9 min - Exercise E10: report the unseen result
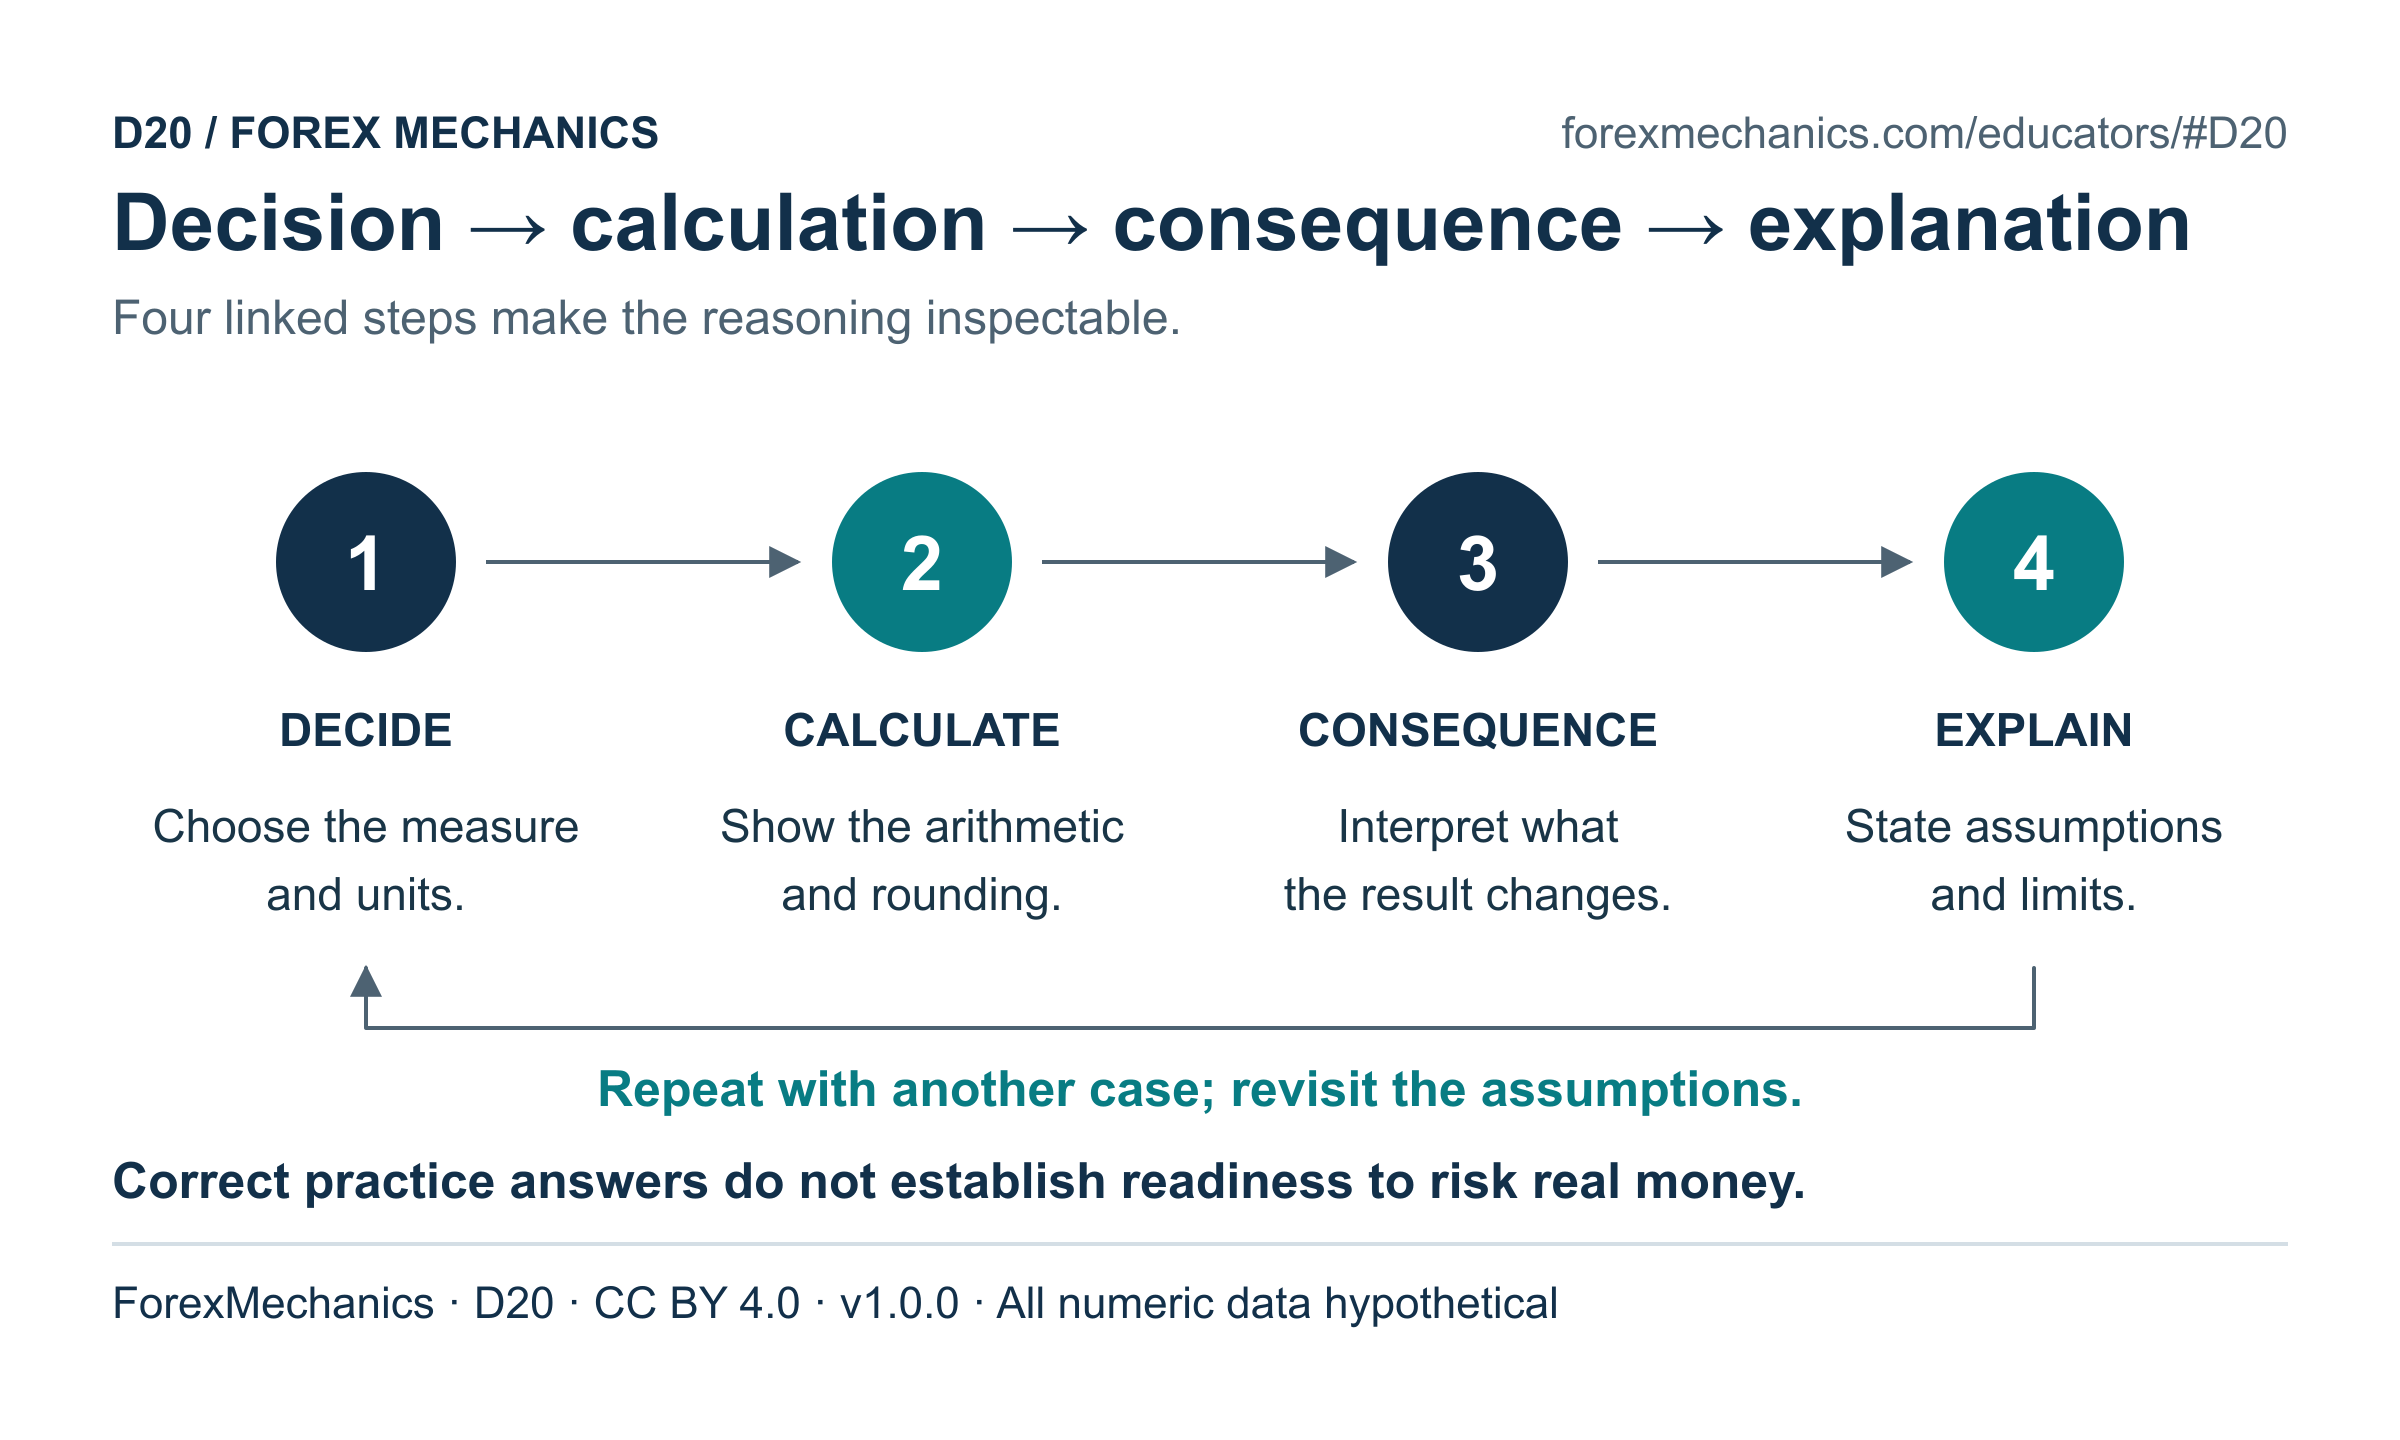
Learners calculate the holdout mean without adding the training result or deducting already-included costs. Check the out-of-sample case. With D20 and the strategy testing protocol, draft a record of the frozen version, sample boundary and next evaluation step.
- 6 min - Write a limited conclusion
Use the check questions. Each learner writes one sentence reporting the result and sample size, followed by one sentence describing what those observations cannot establish.
Records and strategy results are invented teaching data. The duplicate is known to be accidental; real records need an audit trail rather than deletion based only on a repeated-looking row. Three or five observations are descriptive examples, not evidence of stable performance. This lesson assesses record handling and reasoning, not profitability or readiness to risk money.
Twenty diagrams you can reuse
Download an editable SVG for slides or a 2400-pixel PNG for a handout. Each diagram carries its source, version and license. Check the caption and assumptions before adapting it.
20 diagrams
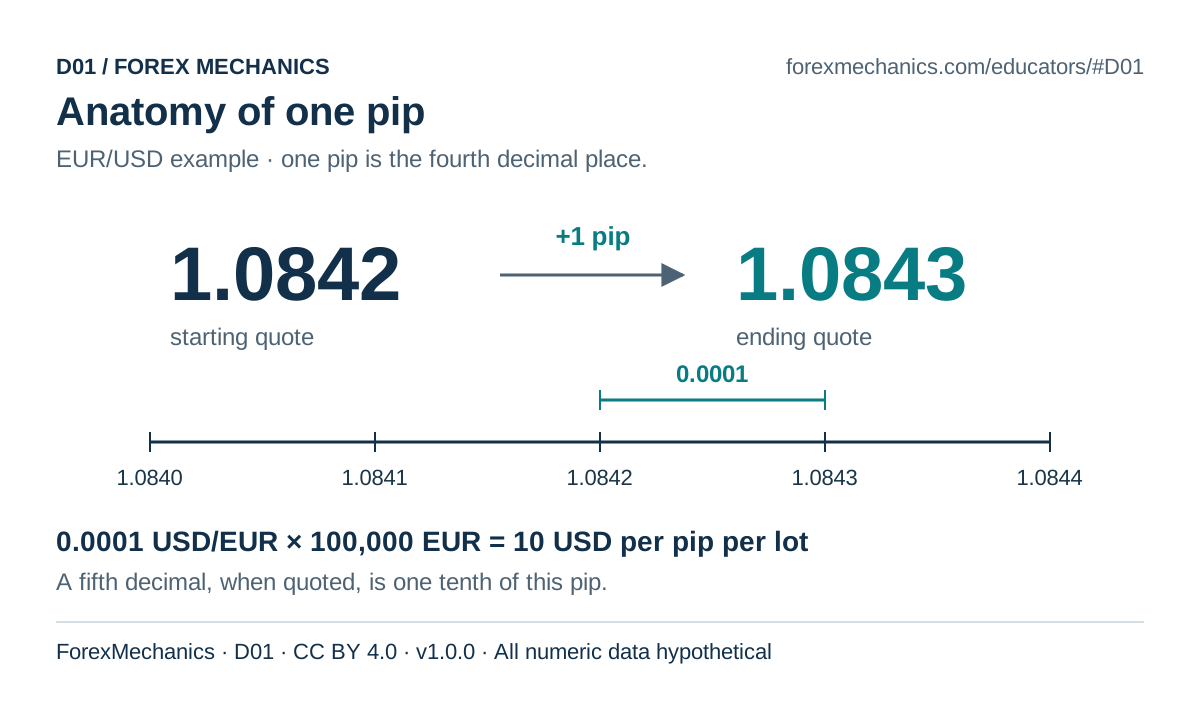
D01 · CC BY 4.0
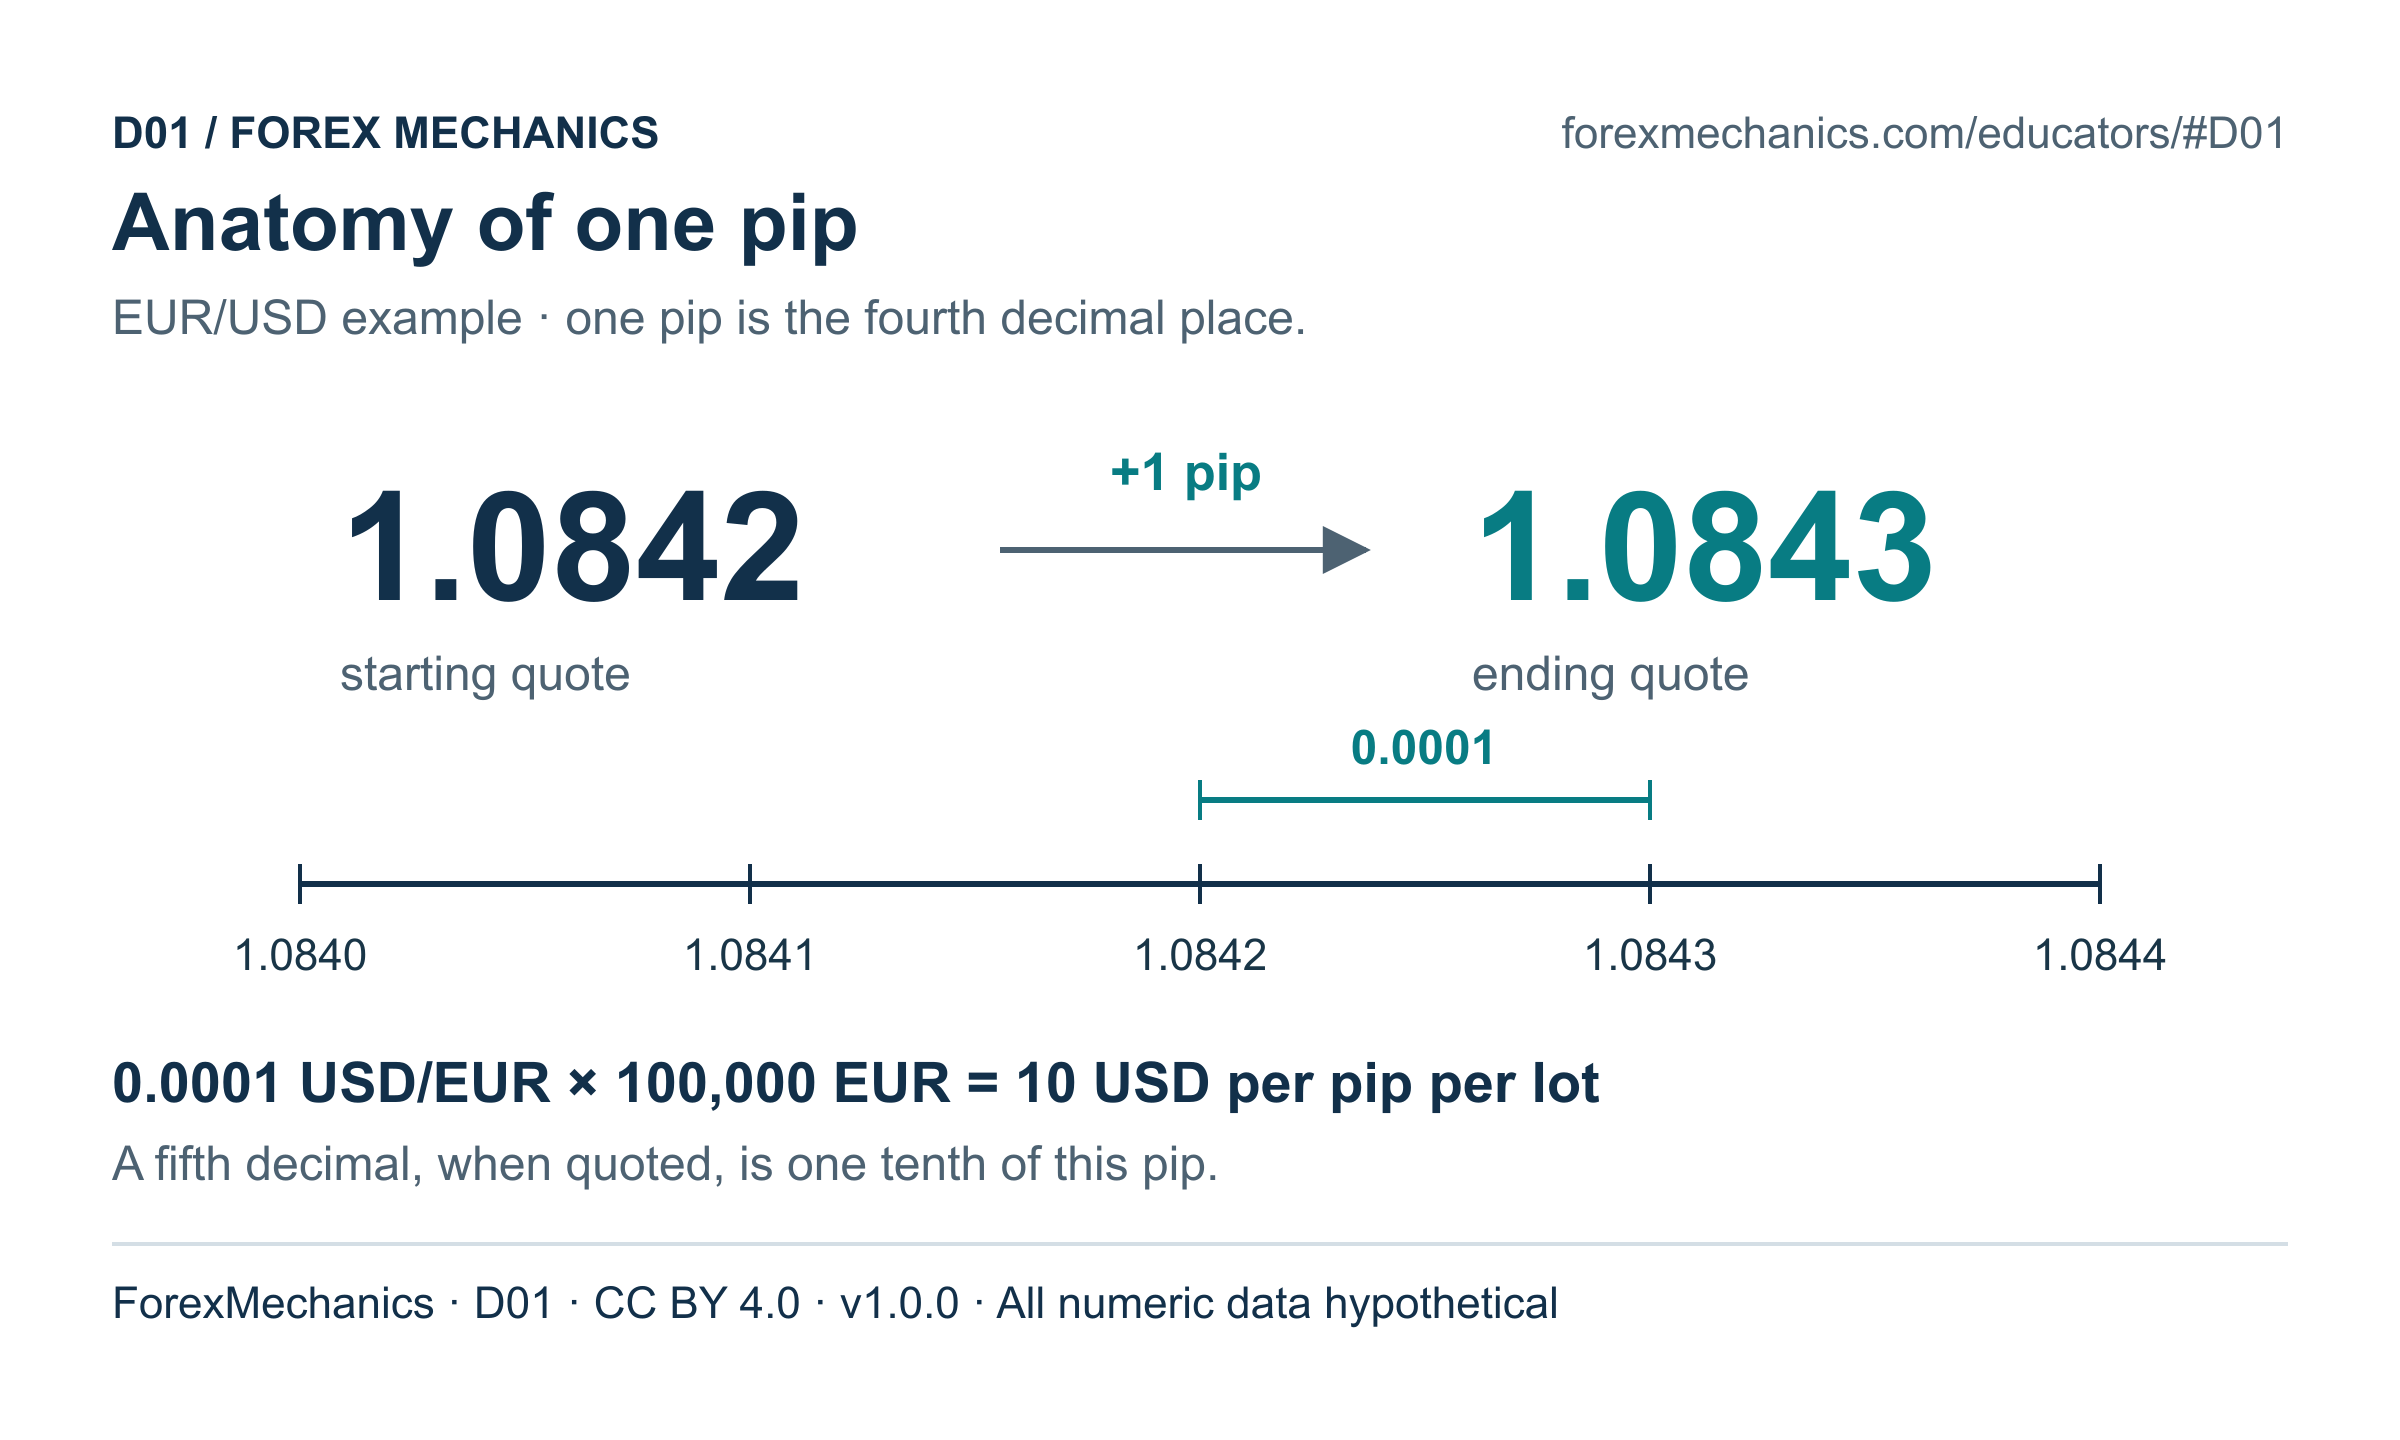
Anatomy of one pip
One pip is a price increment. Its cash value also depends on contract size and account currency.
Source credit
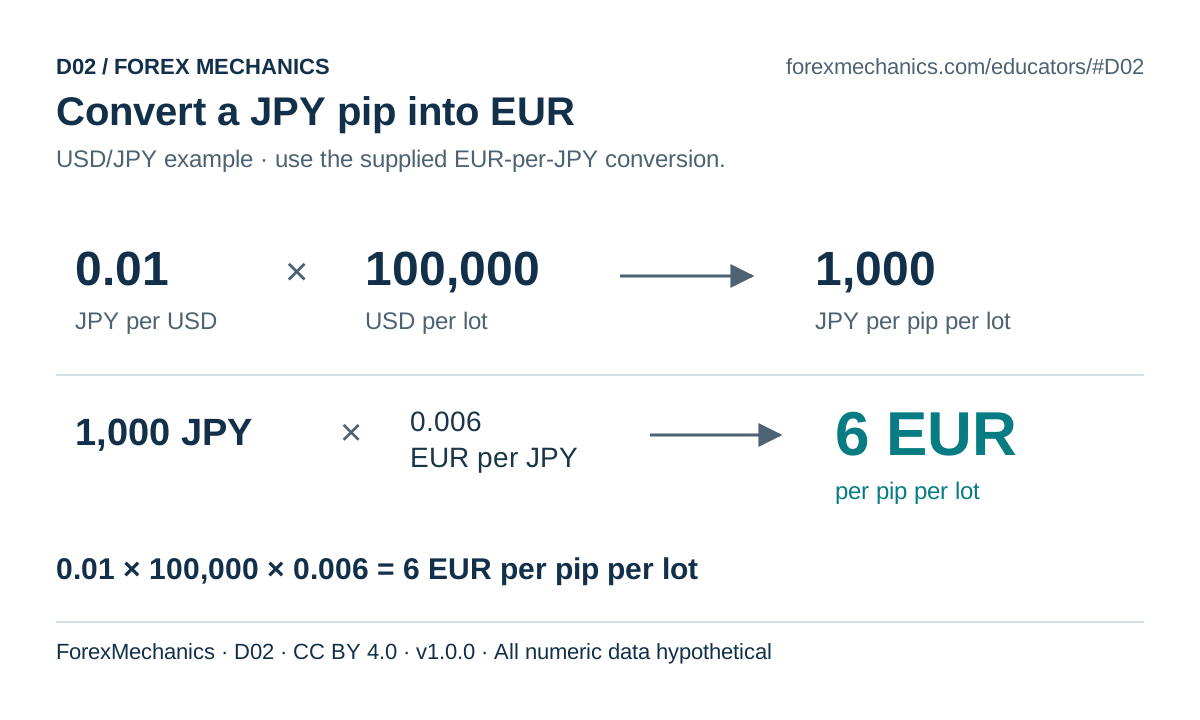
D02 · CC BY 4.0
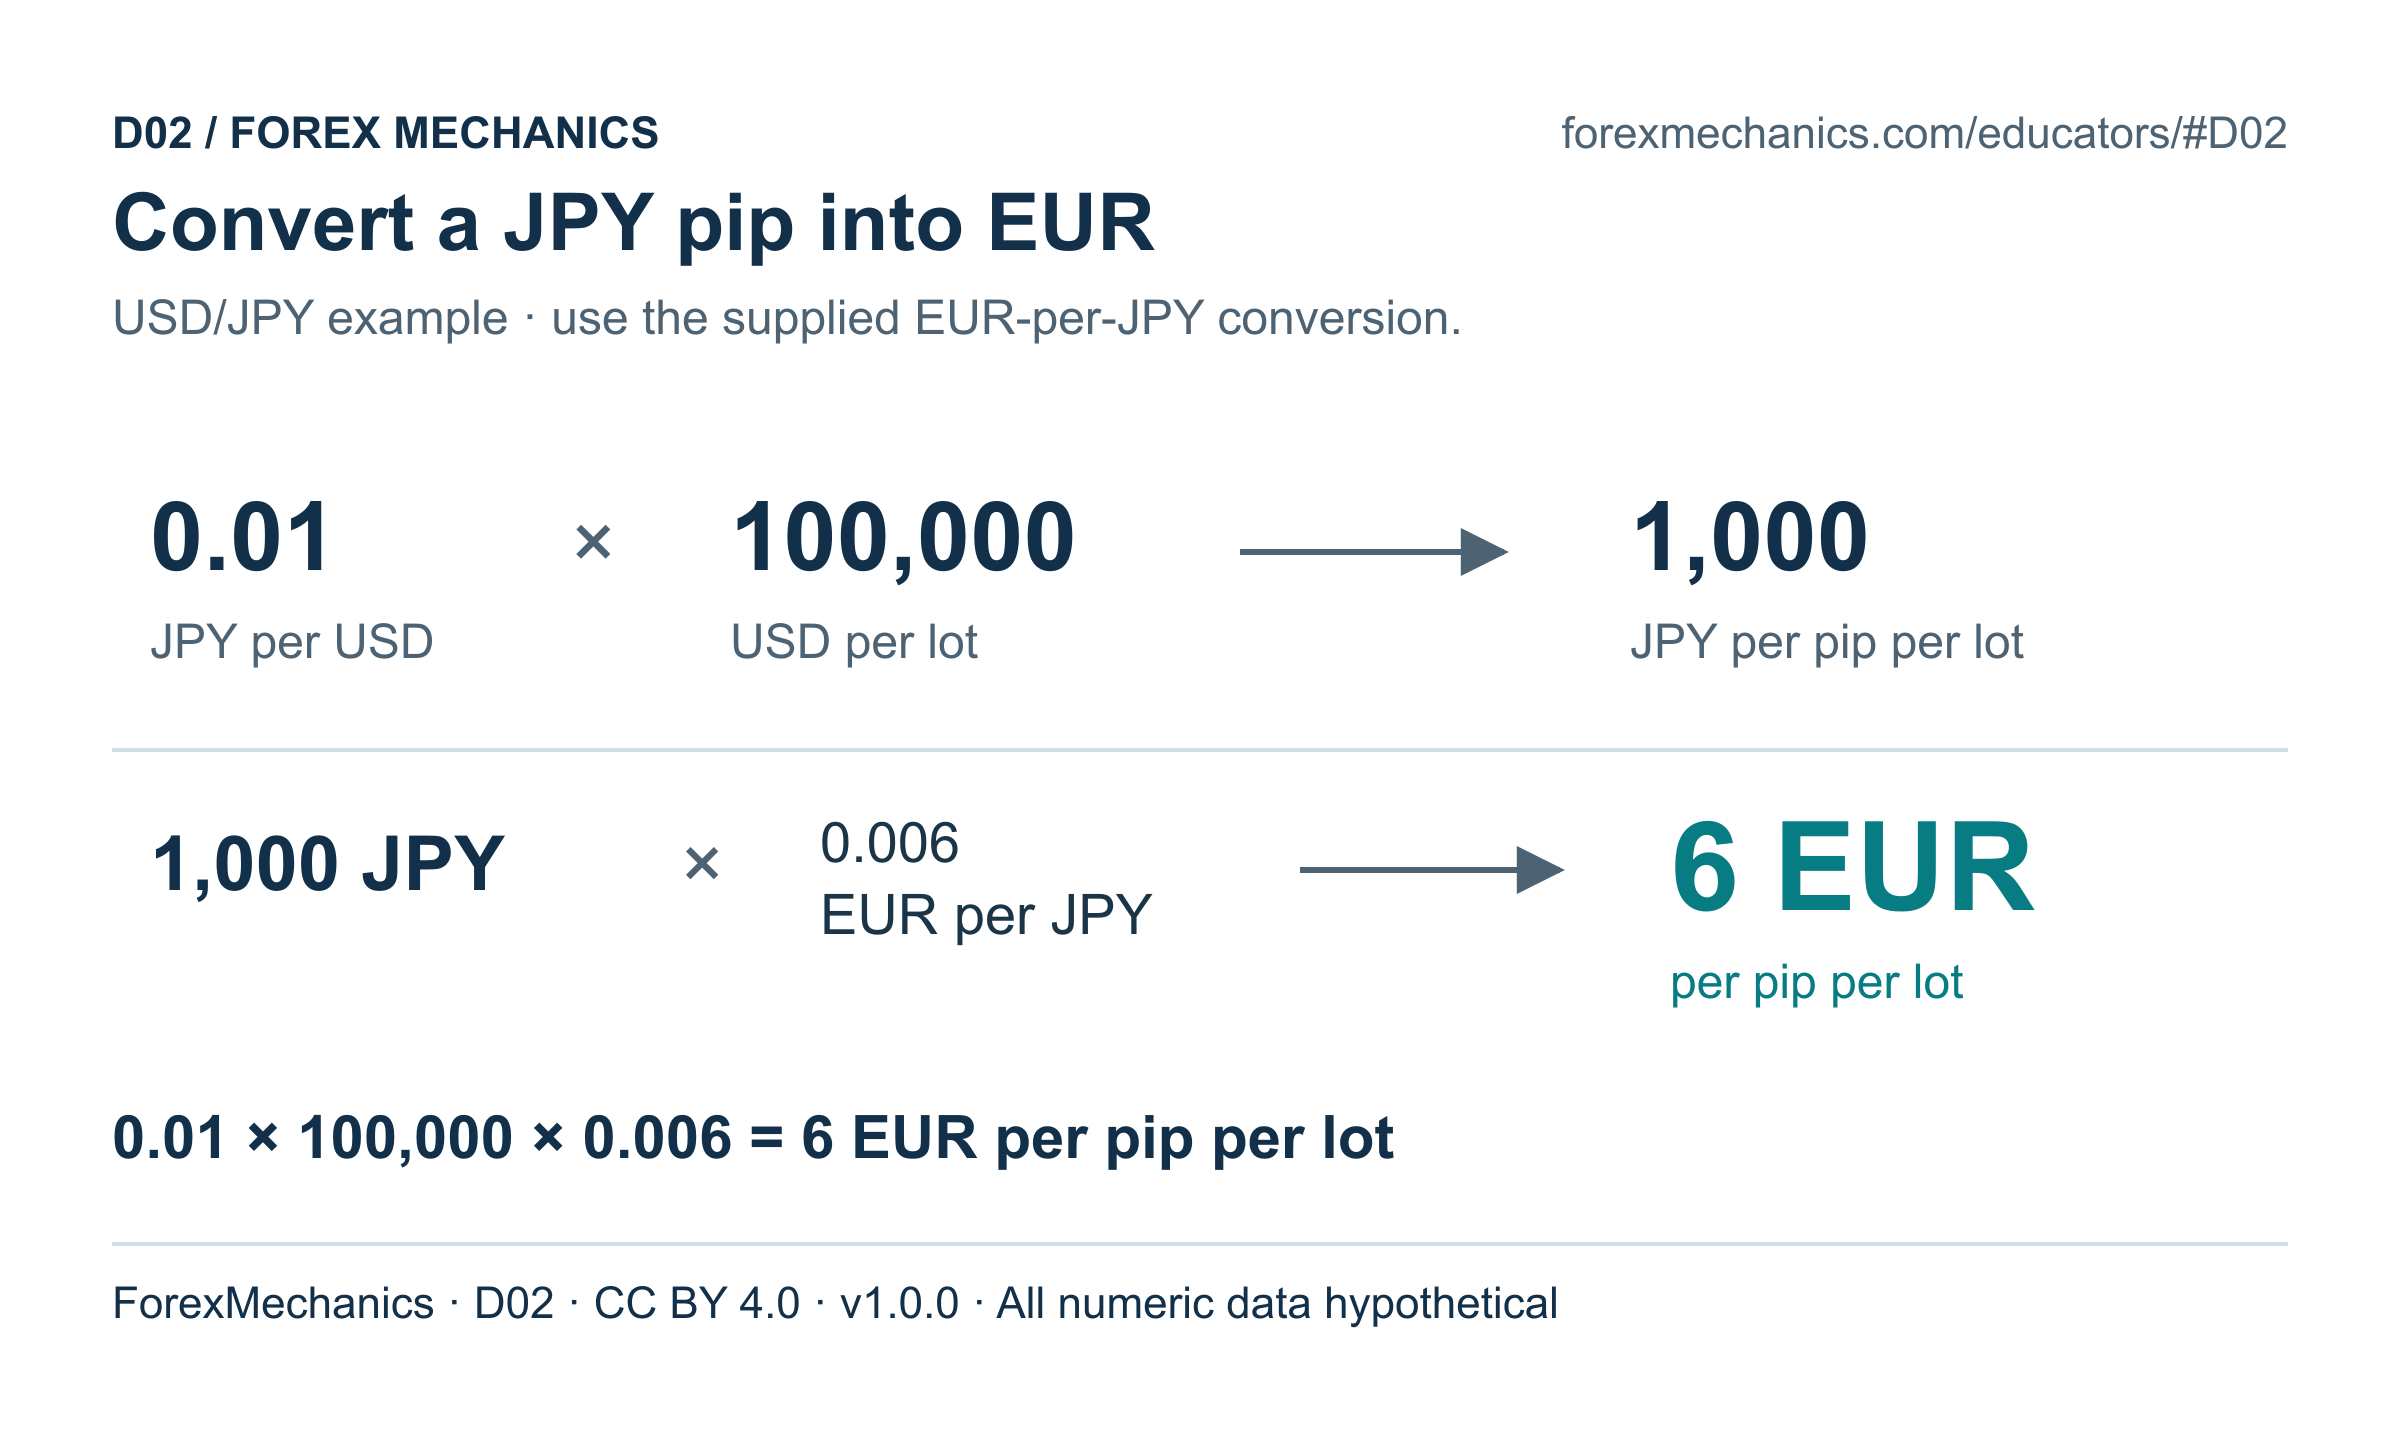
Convert a JPY pip into EUR
Carry the units through the calculation before converting the quote-currency pip value into the account currency.
Source credit
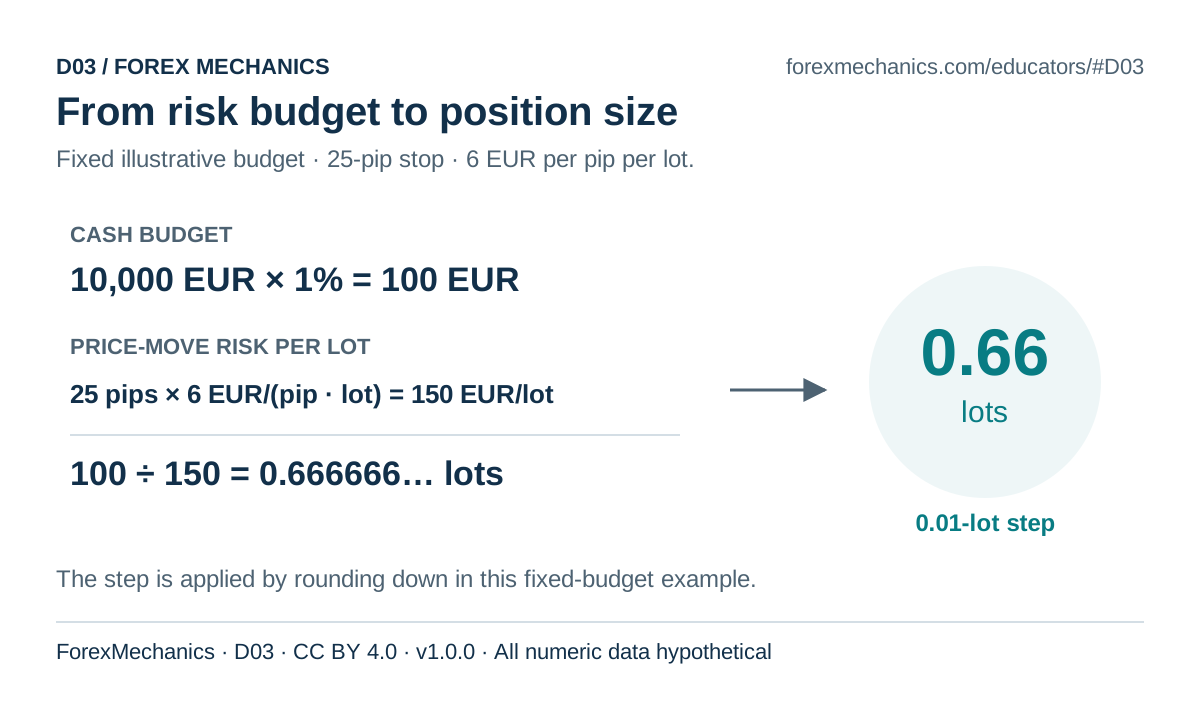
D03 · CC BY 4.0
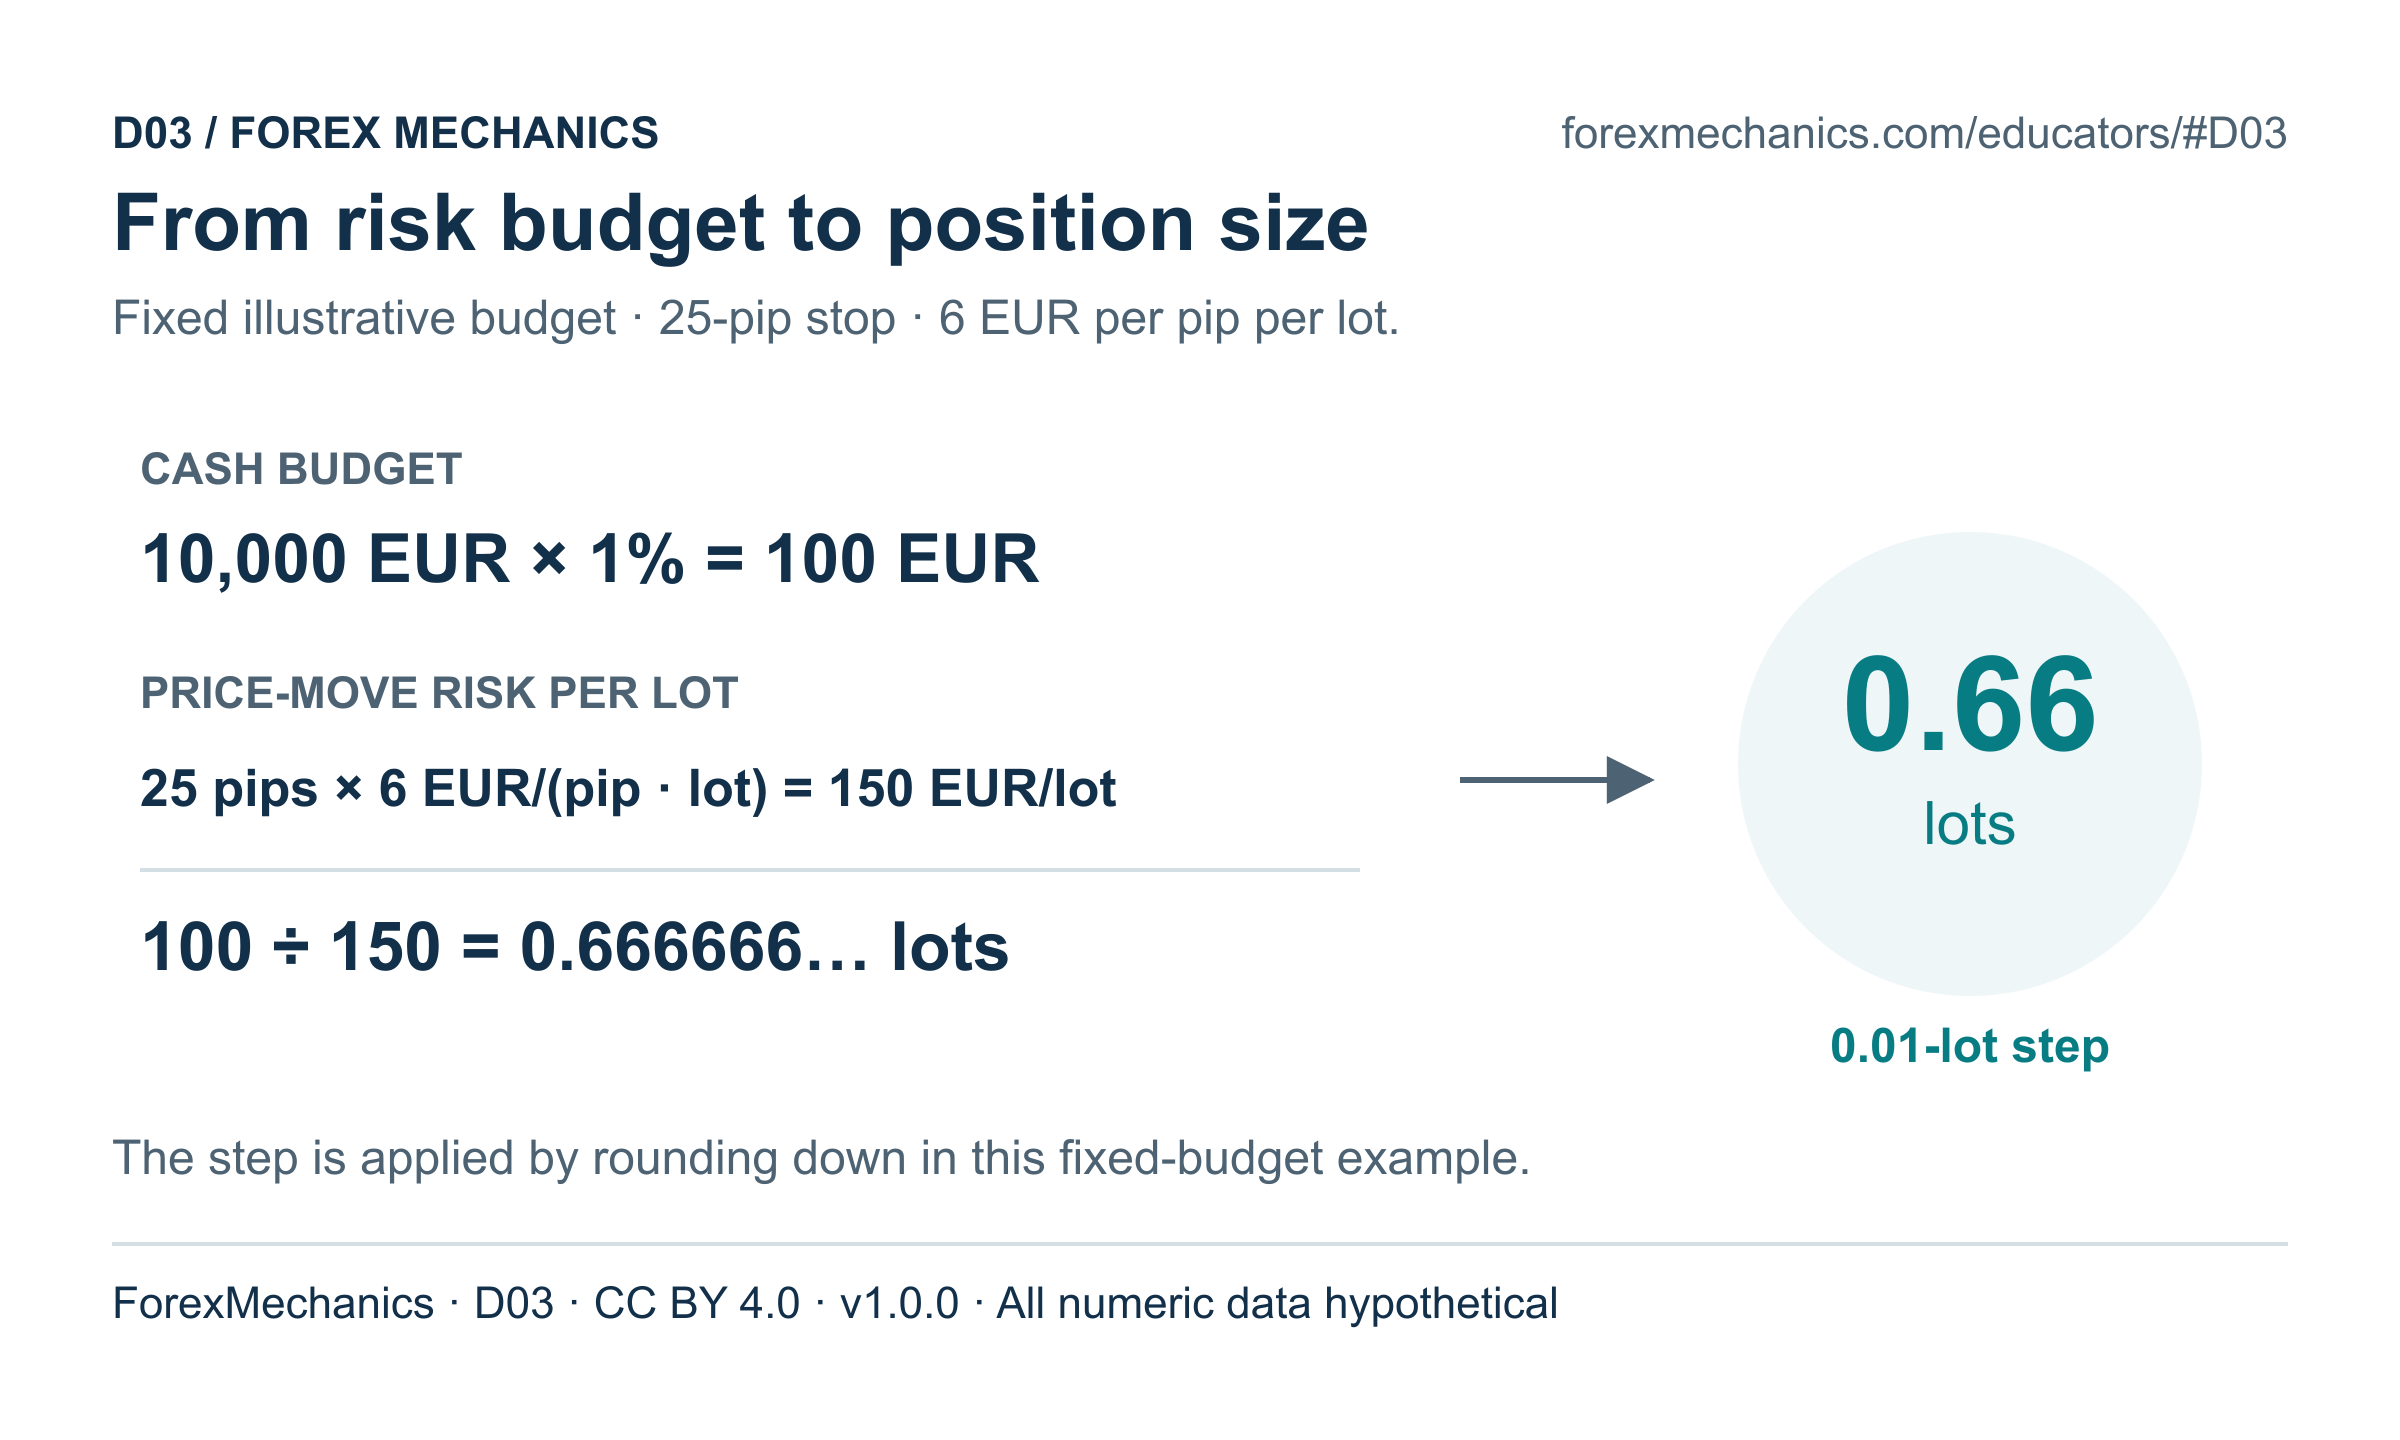
From risk budget to position size
Divide the cash budget by risk per lot; apply the volume step after calculating the unrounded size.
Source credit
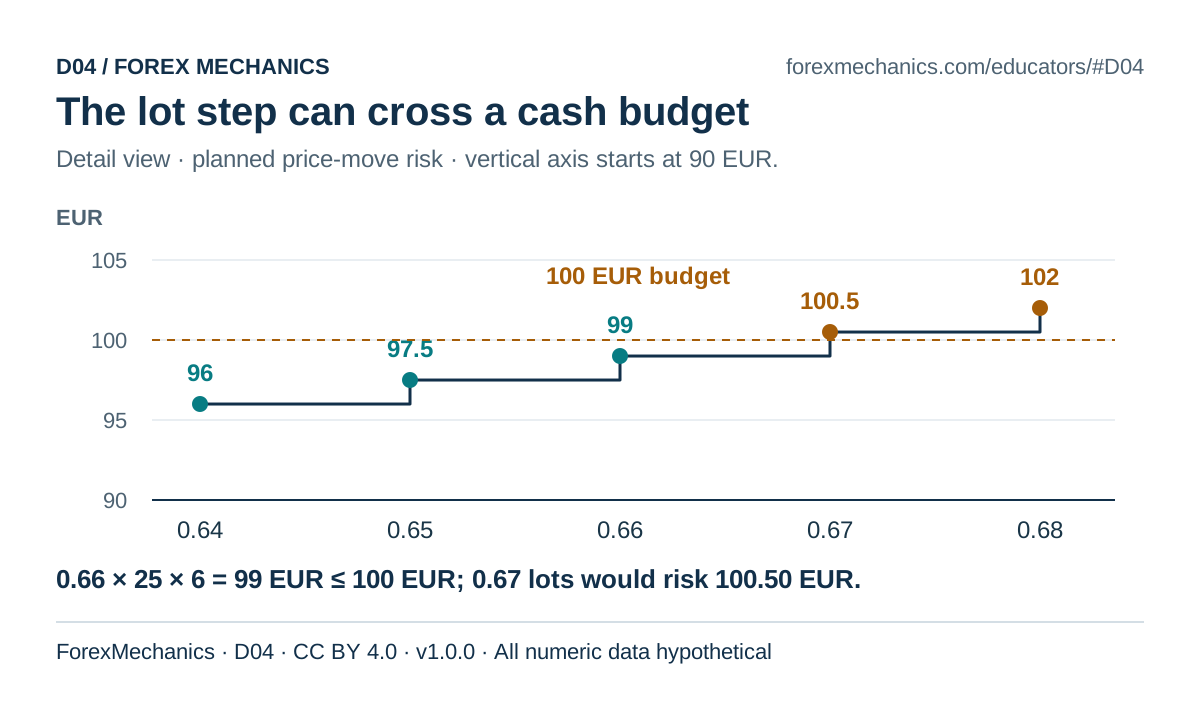
D04 · CC BY 4.0
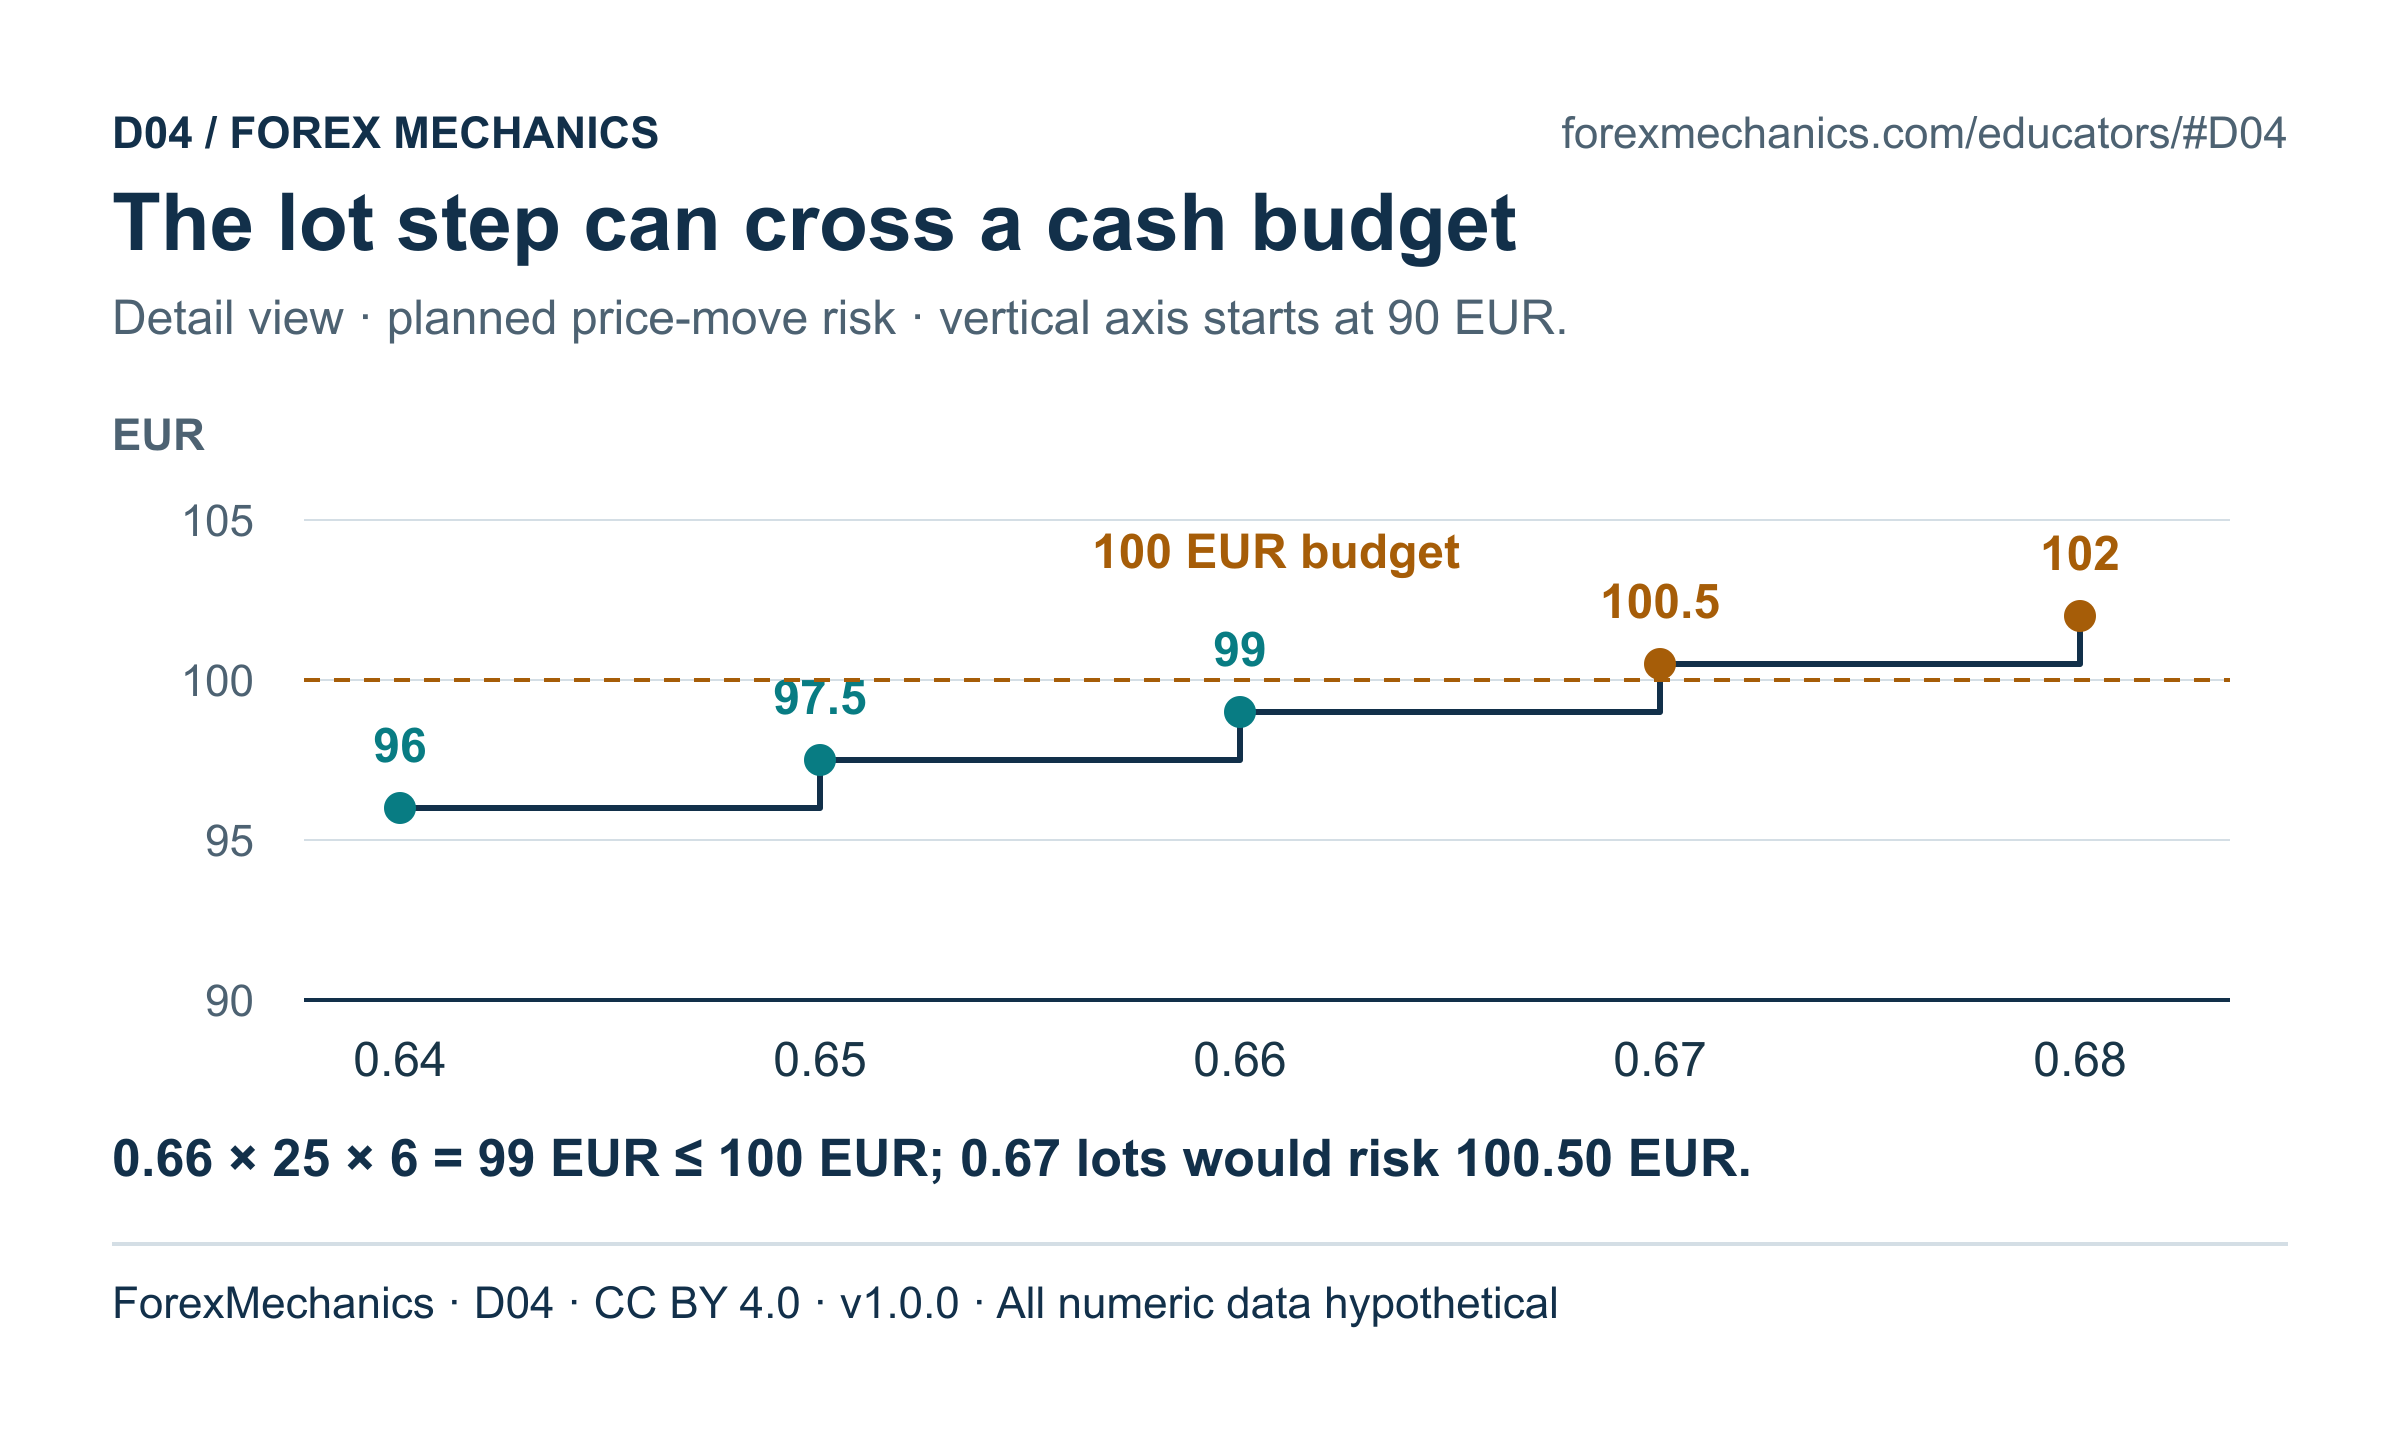
The lot step can cross a cash budget
Theoretical size is 0.666666 lots. A 0.67-lot rounded-up position exceeds the hypothetical 100 EUR budget.
Source credit
D05 · CC BY 4.0
A gross edge can disappear after costs
Costs are deducted once per trade from these explicitly gross payoffs; an already-net journal requires different treatment.
Source credit
D06 · CC BY 4.0
Break-even win rate includes costs
Break-even is a model threshold, not a forecast of the win rate a trader or strategy will achieve.
Source credit
D07 · CC BY 4.0
Three pair names, one shared USD leg
Signed currency legs reveal a common USD direction. These exposure units are neither a borrowed cash balance nor a maximum-loss amount.
Source credit
D08 · CC BY 4.0
Exposure and stop budgets measure different things
Currency direction, planned price-move loss and execution uncertainty require separate interpretations.
Source credit
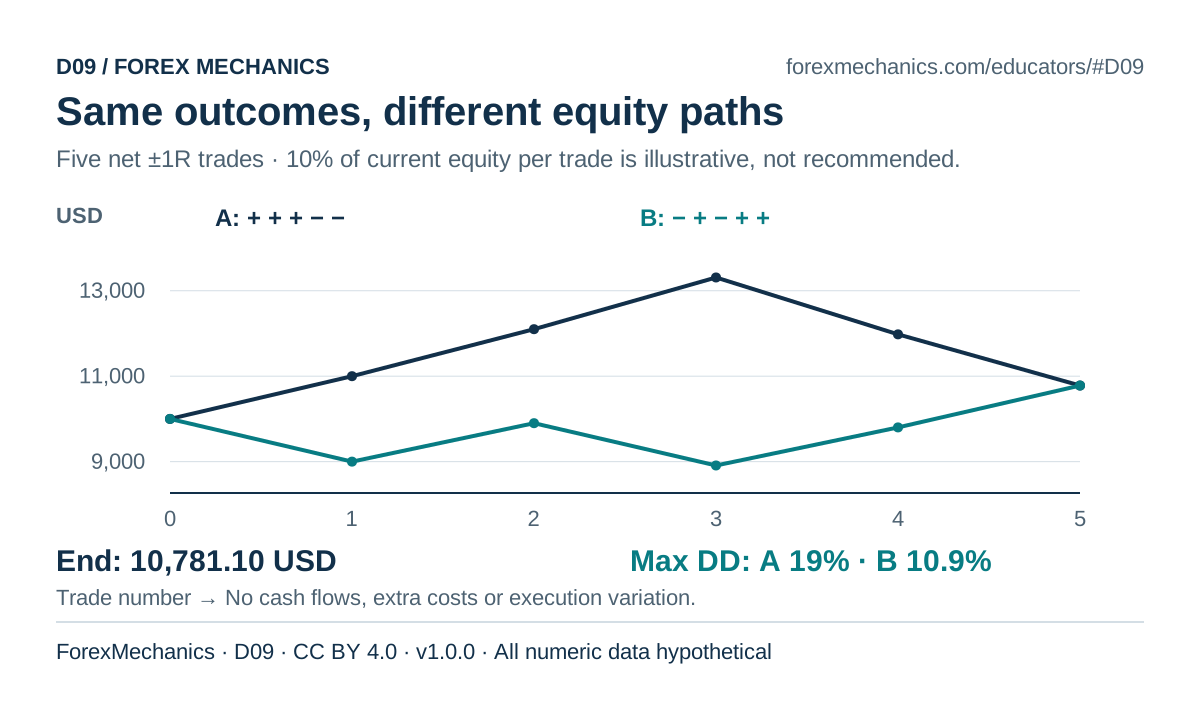
D09 · CC BY 4.0
Same outcomes, different equity paths
The order of the same multiplicative returns leaves this endpoint unchanged while changing peak-to-trough drawdown.
Source credit
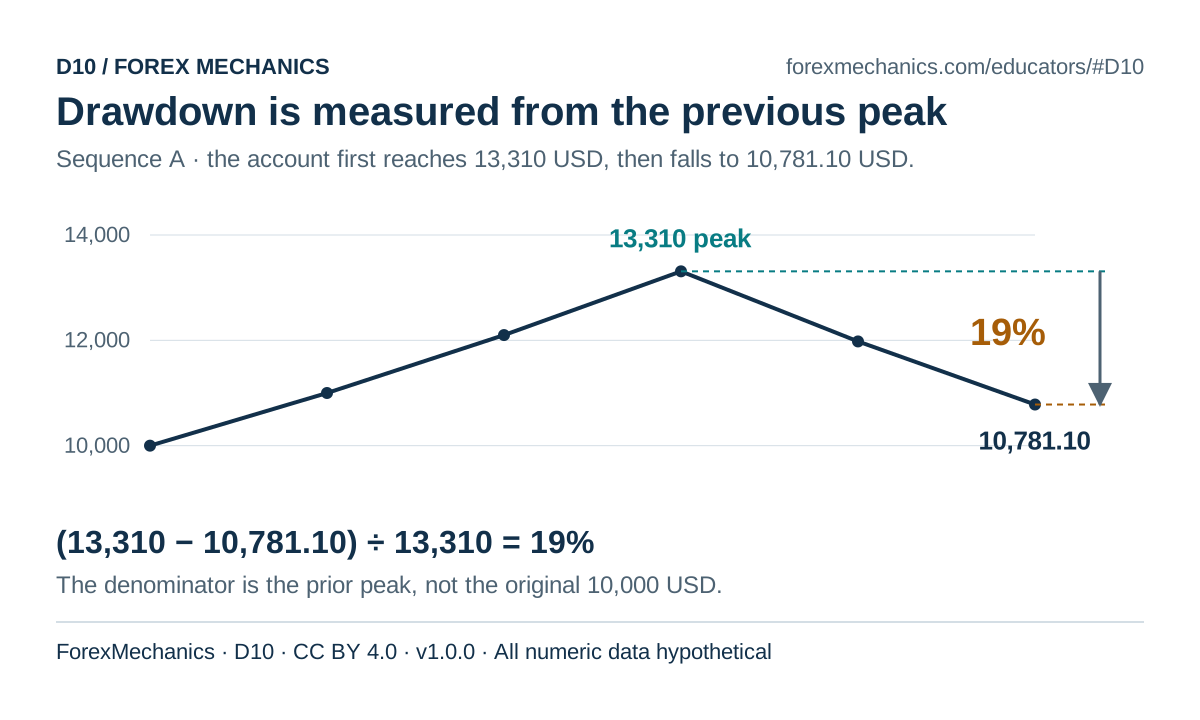
D10 · CC BY 4.0
Drawdown is measured from the previous peak
A positive result versus the starting account can coexist with a material drawdown from an intermediate high.
Source credit
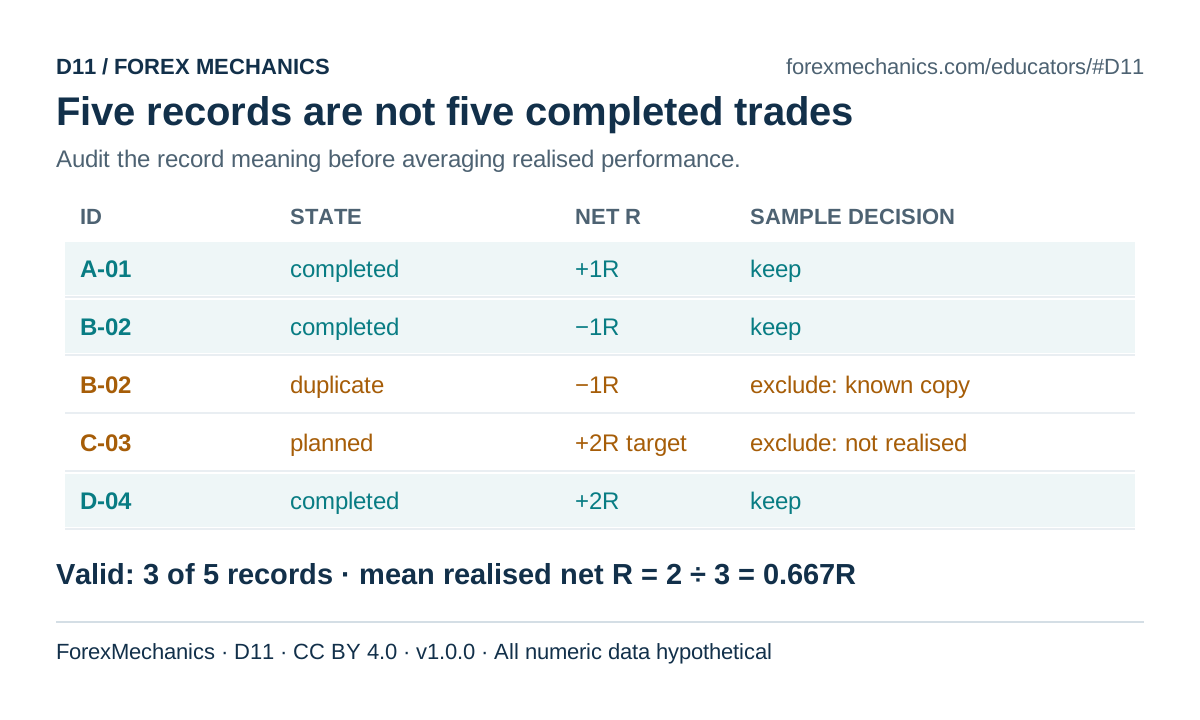
D11 · CC BY 4.0
Five records are not five completed trades
Valid sample: three unique completed trades. Their realised net mean is (1 − 1 + 2) / 3 = 0.667R.
Source credit
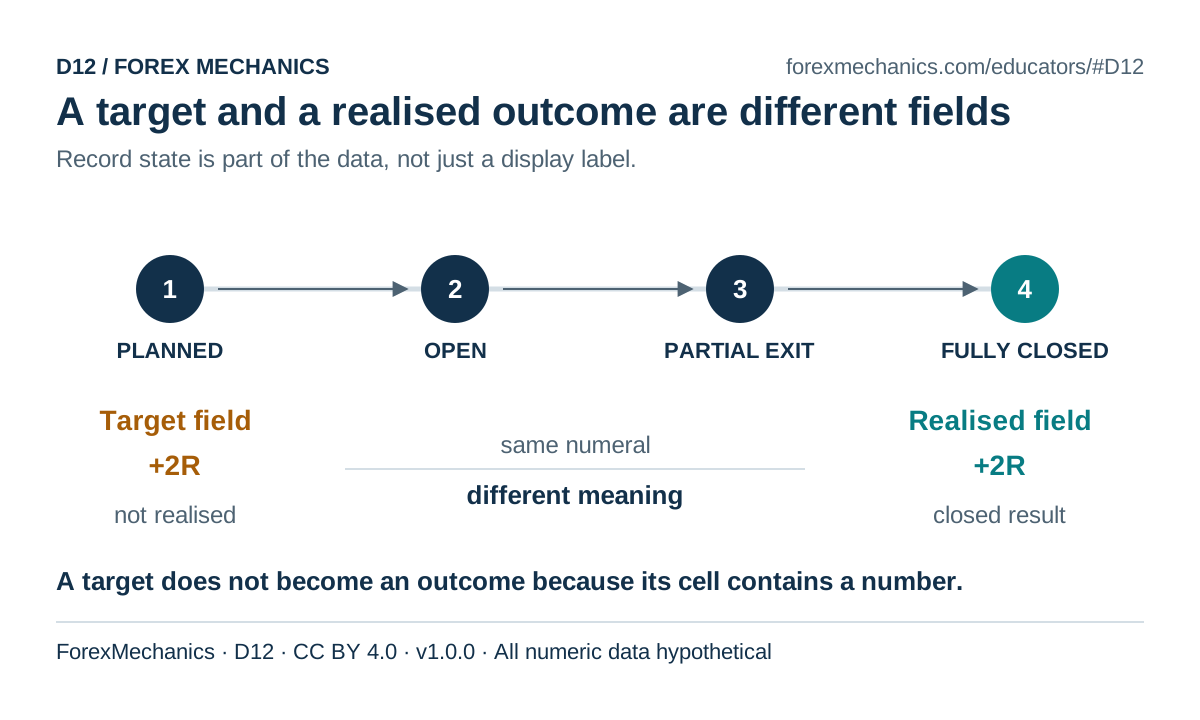
D12 · CC BY 4.0
A target and a realised outcome are different fields
A completed-trade performance sample needs the defined completed record and realised outcome, not an unexecuted target.
Source credit
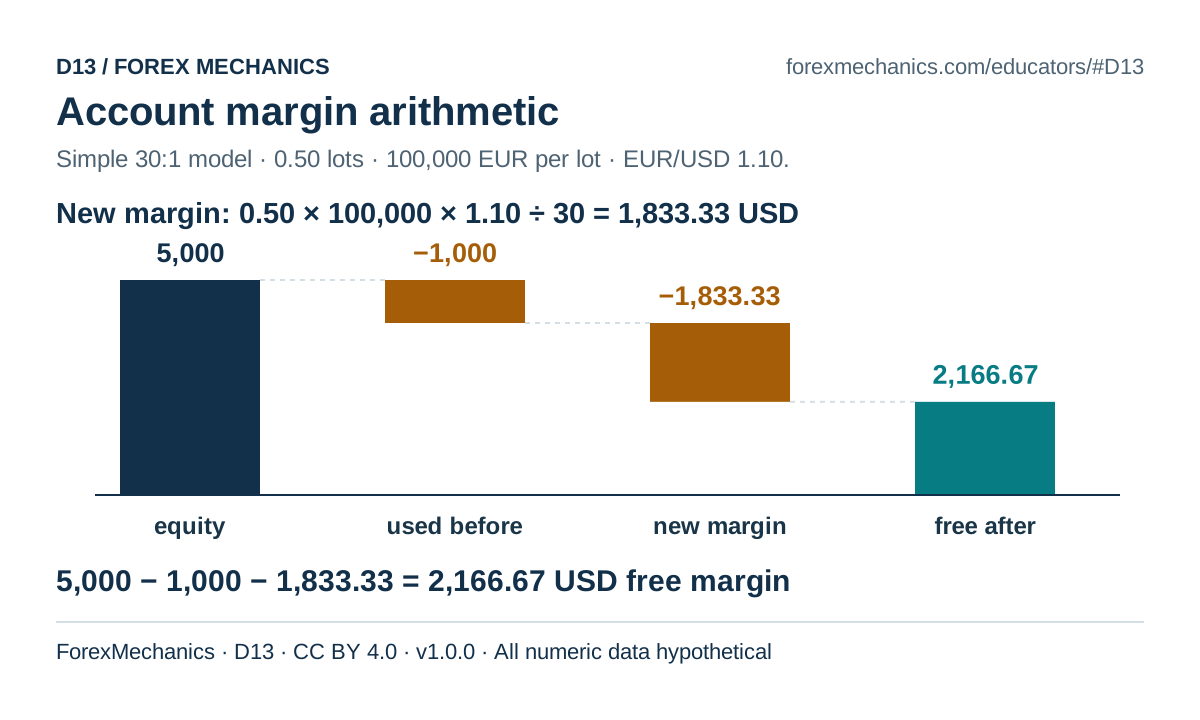
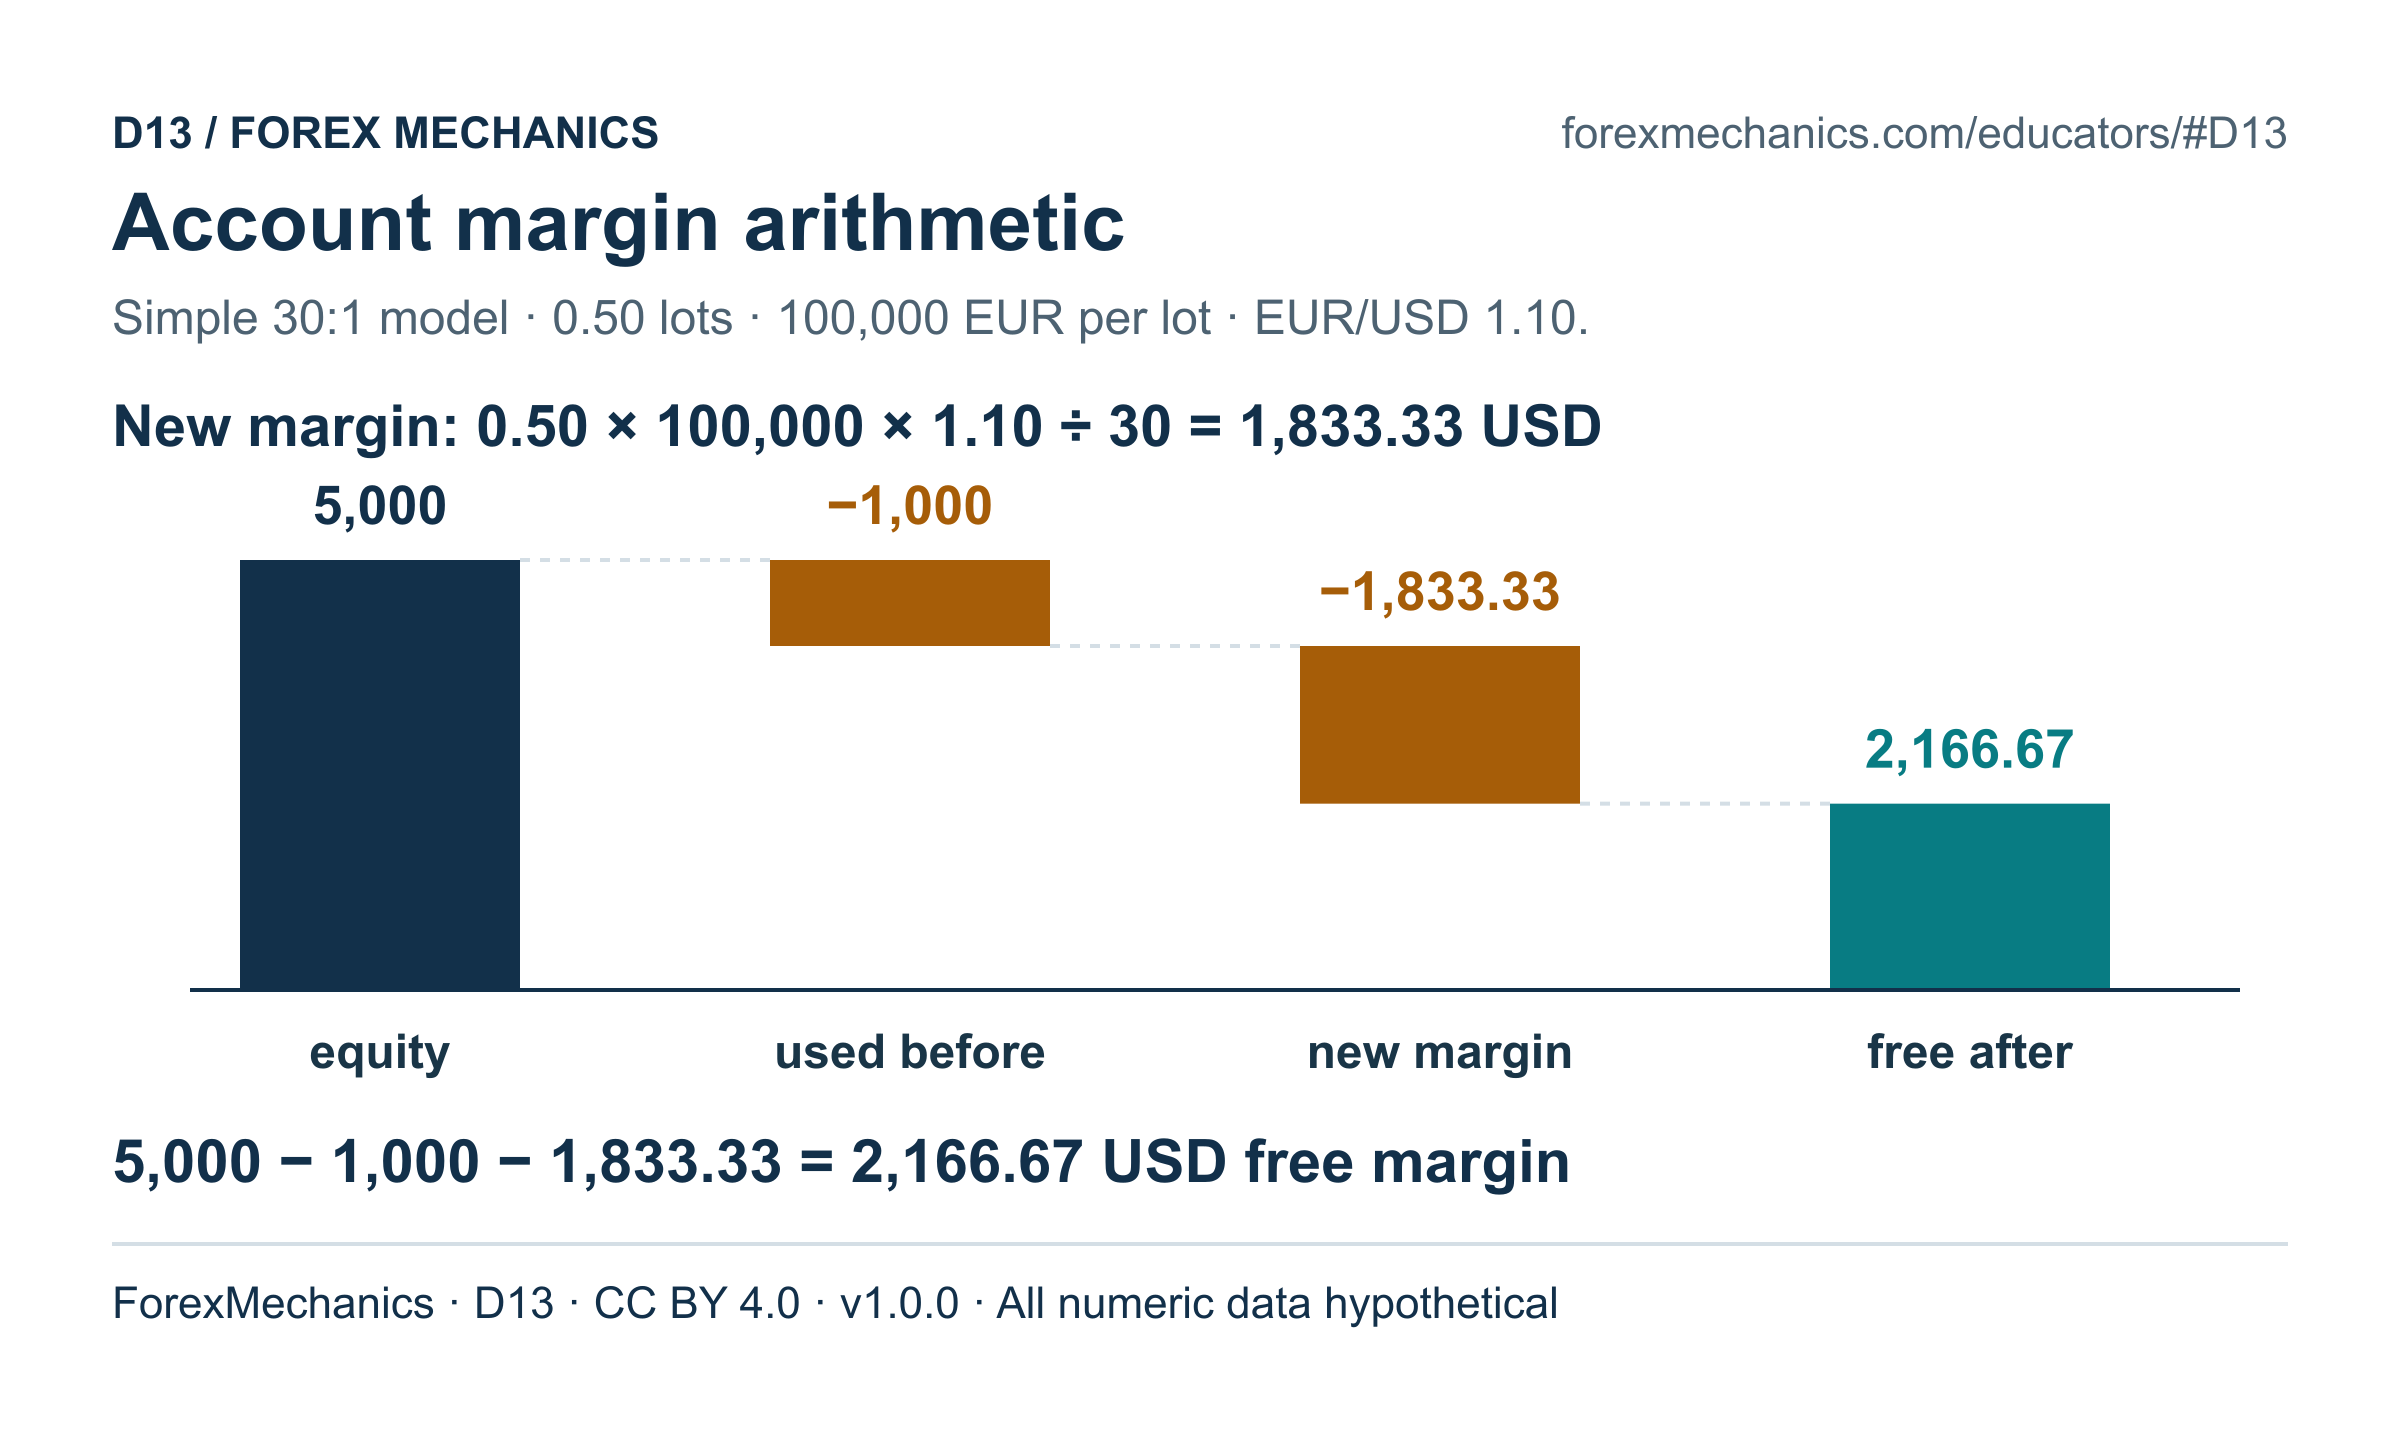
D13 · CC BY 4.0
Account margin arithmetic
Equity is held fixed on entry. The simplified model excludes broker tiers, offsets, entry costs and close-out rules.
Source credit
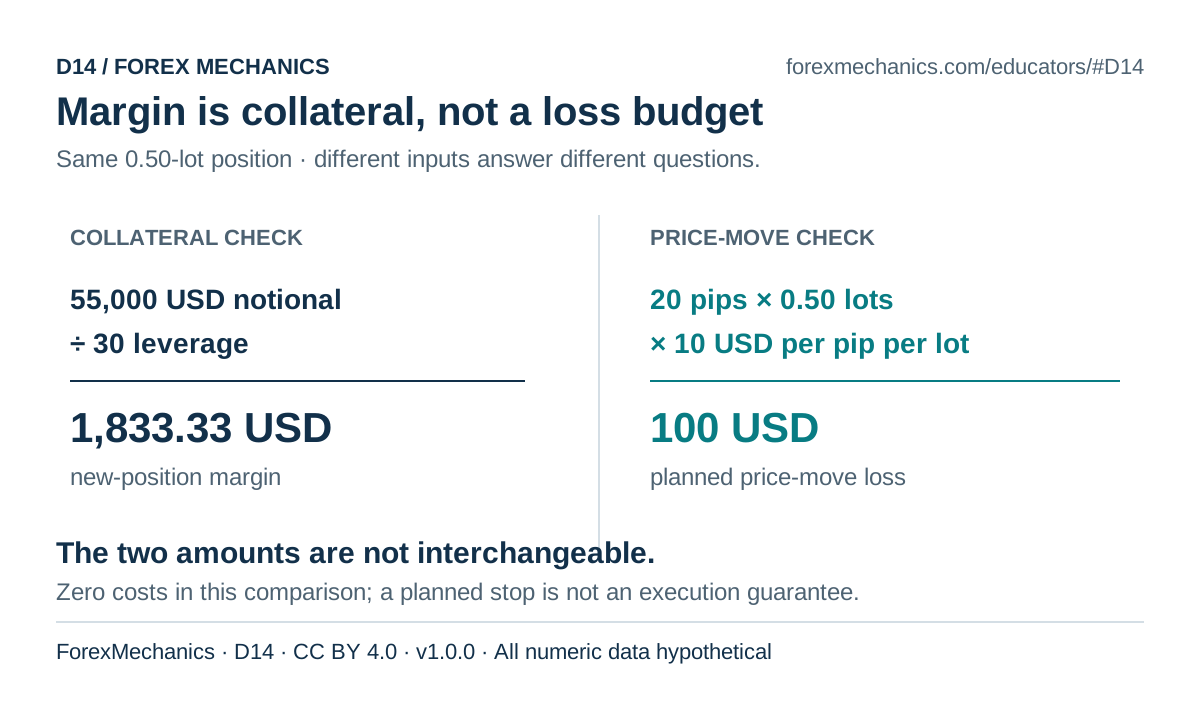
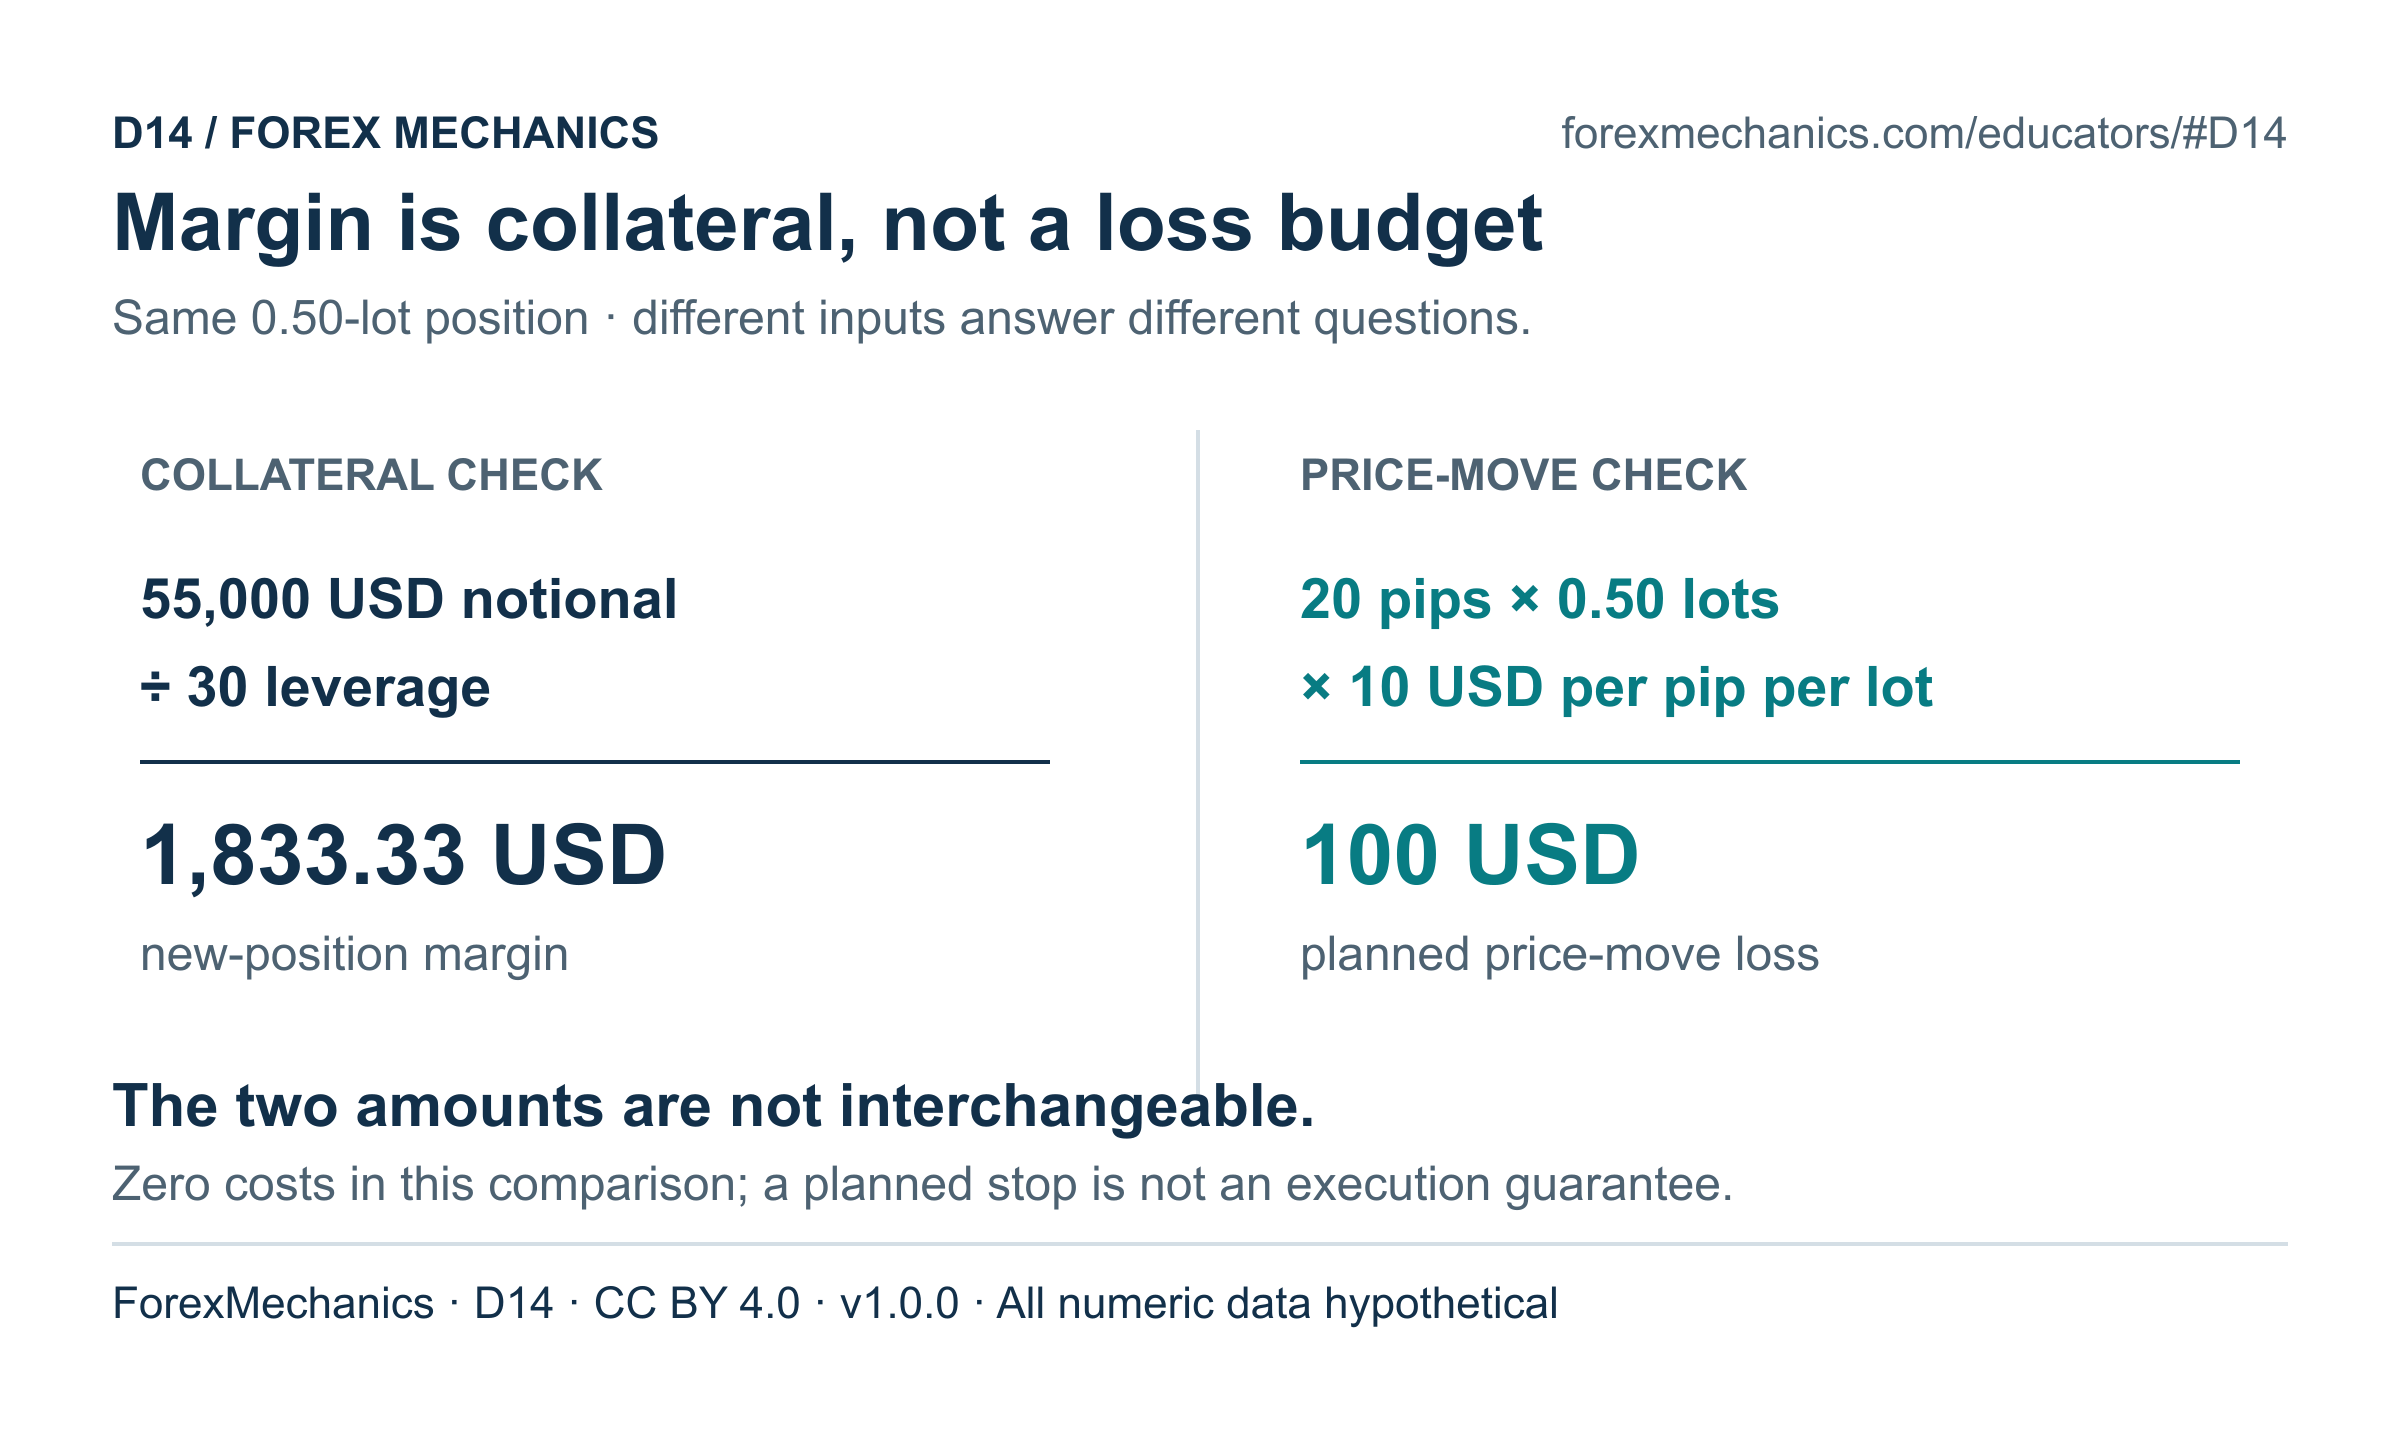
D14 · CC BY 4.0
Margin is collateral, not a loss budget
At a fixed position size, changing leverage changes this margin calculation; it does not change the cash value of the same price move.
Source credit
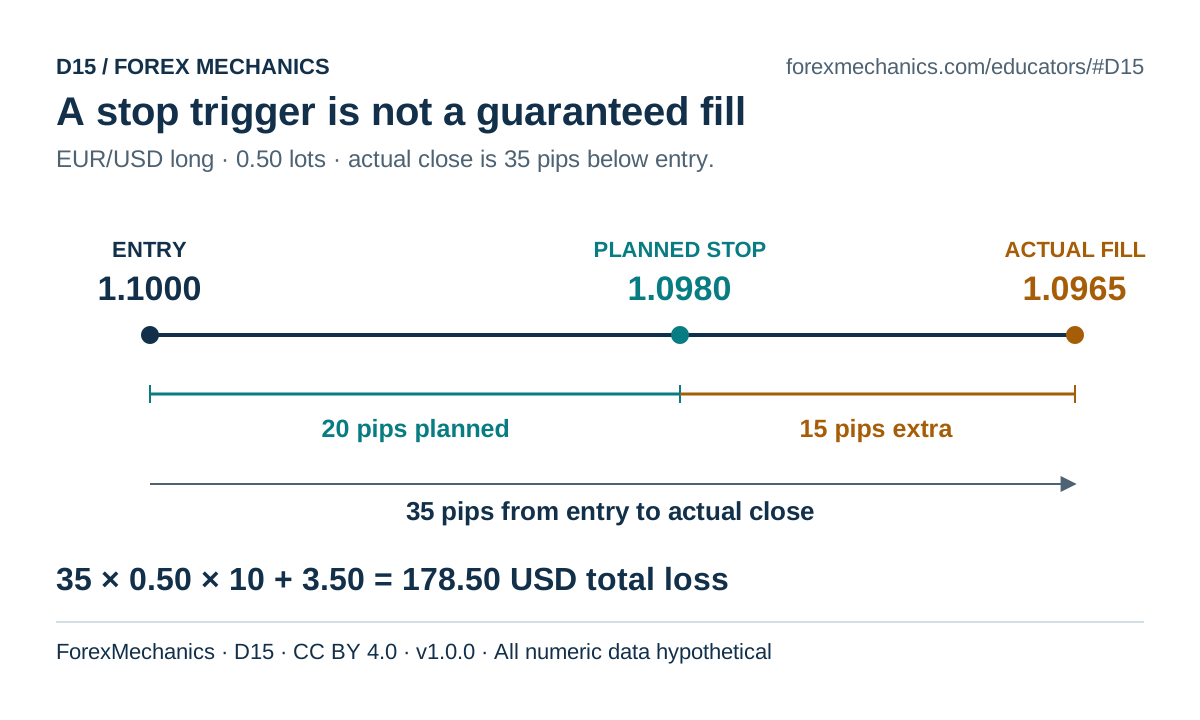
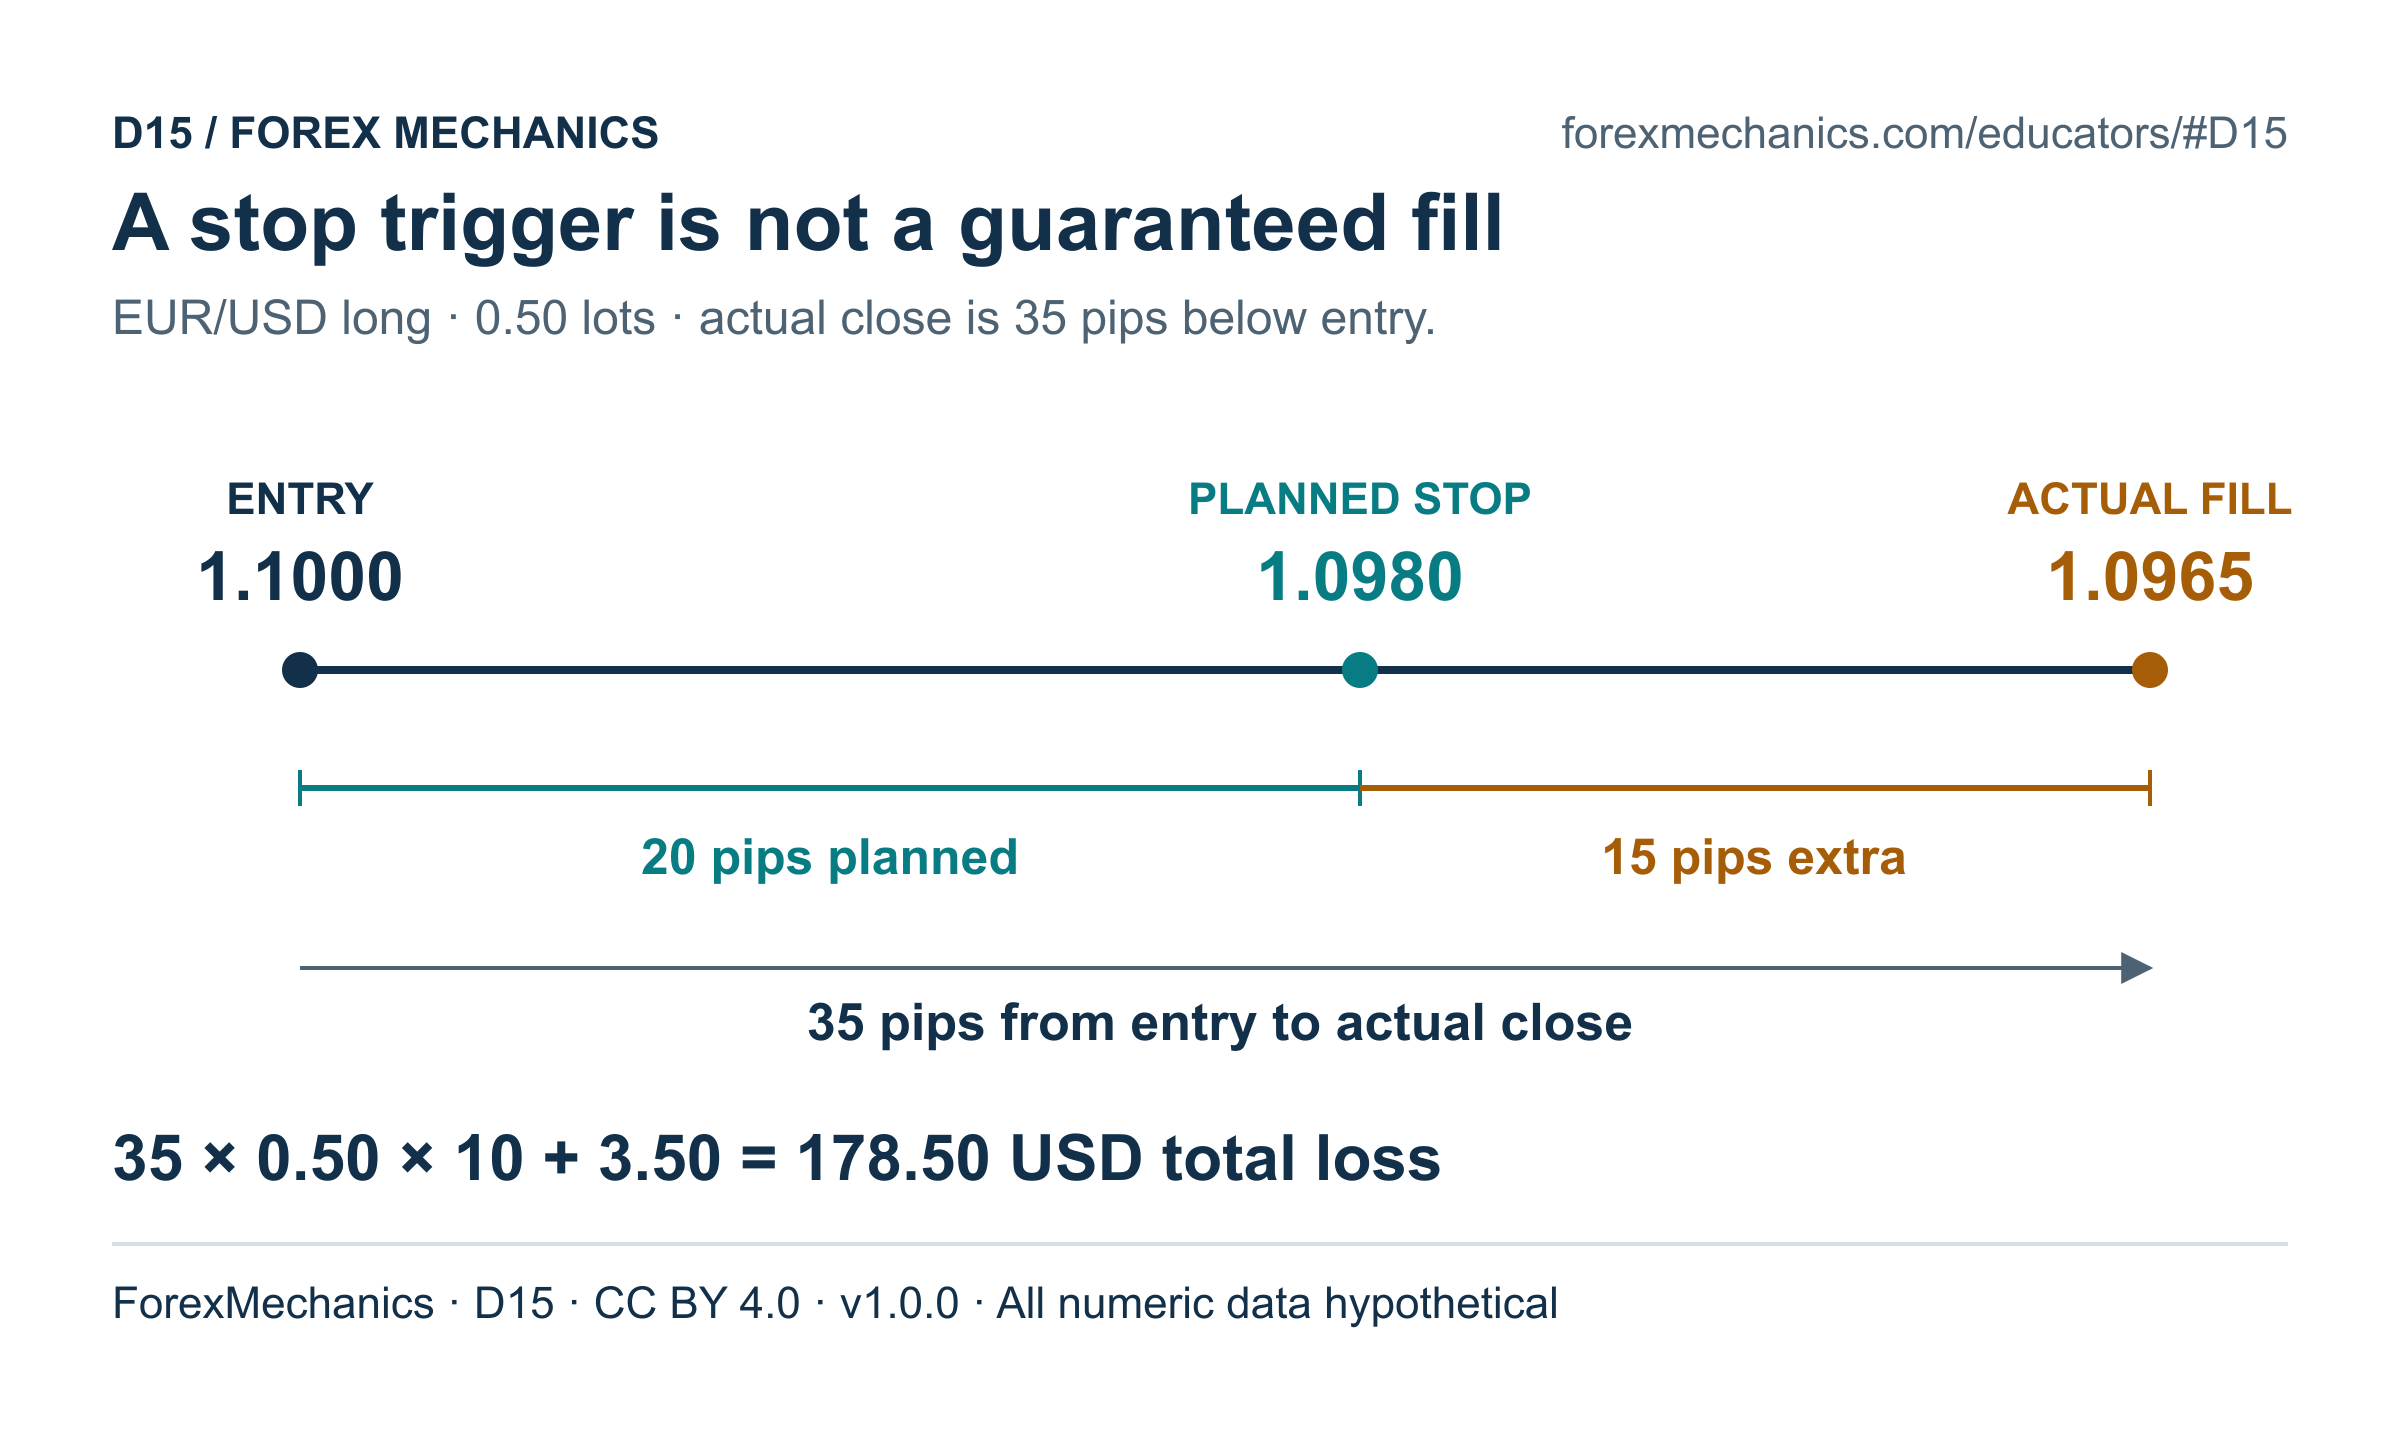
D15 · CC BY 4.0
A stop trigger is not a guaranteed fill
The 35-pip entry-to-fill distance includes the planned 20 pips. Do not add them again or deduct a separately imagined spread.
Source credit
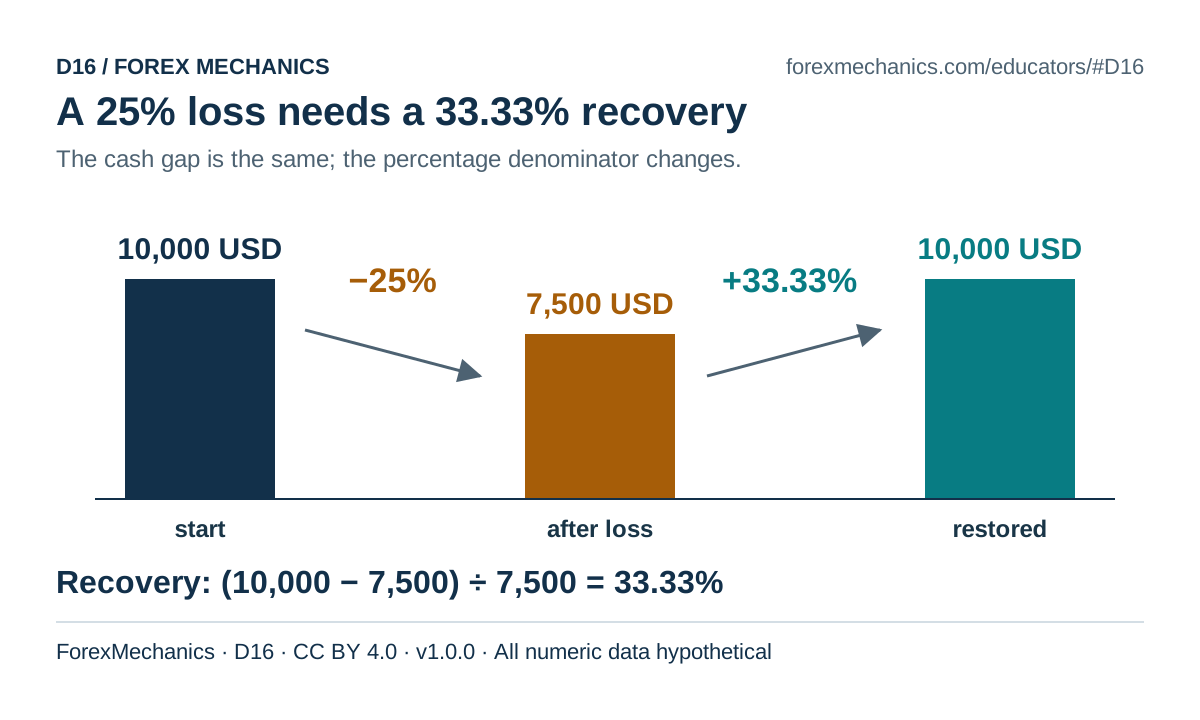
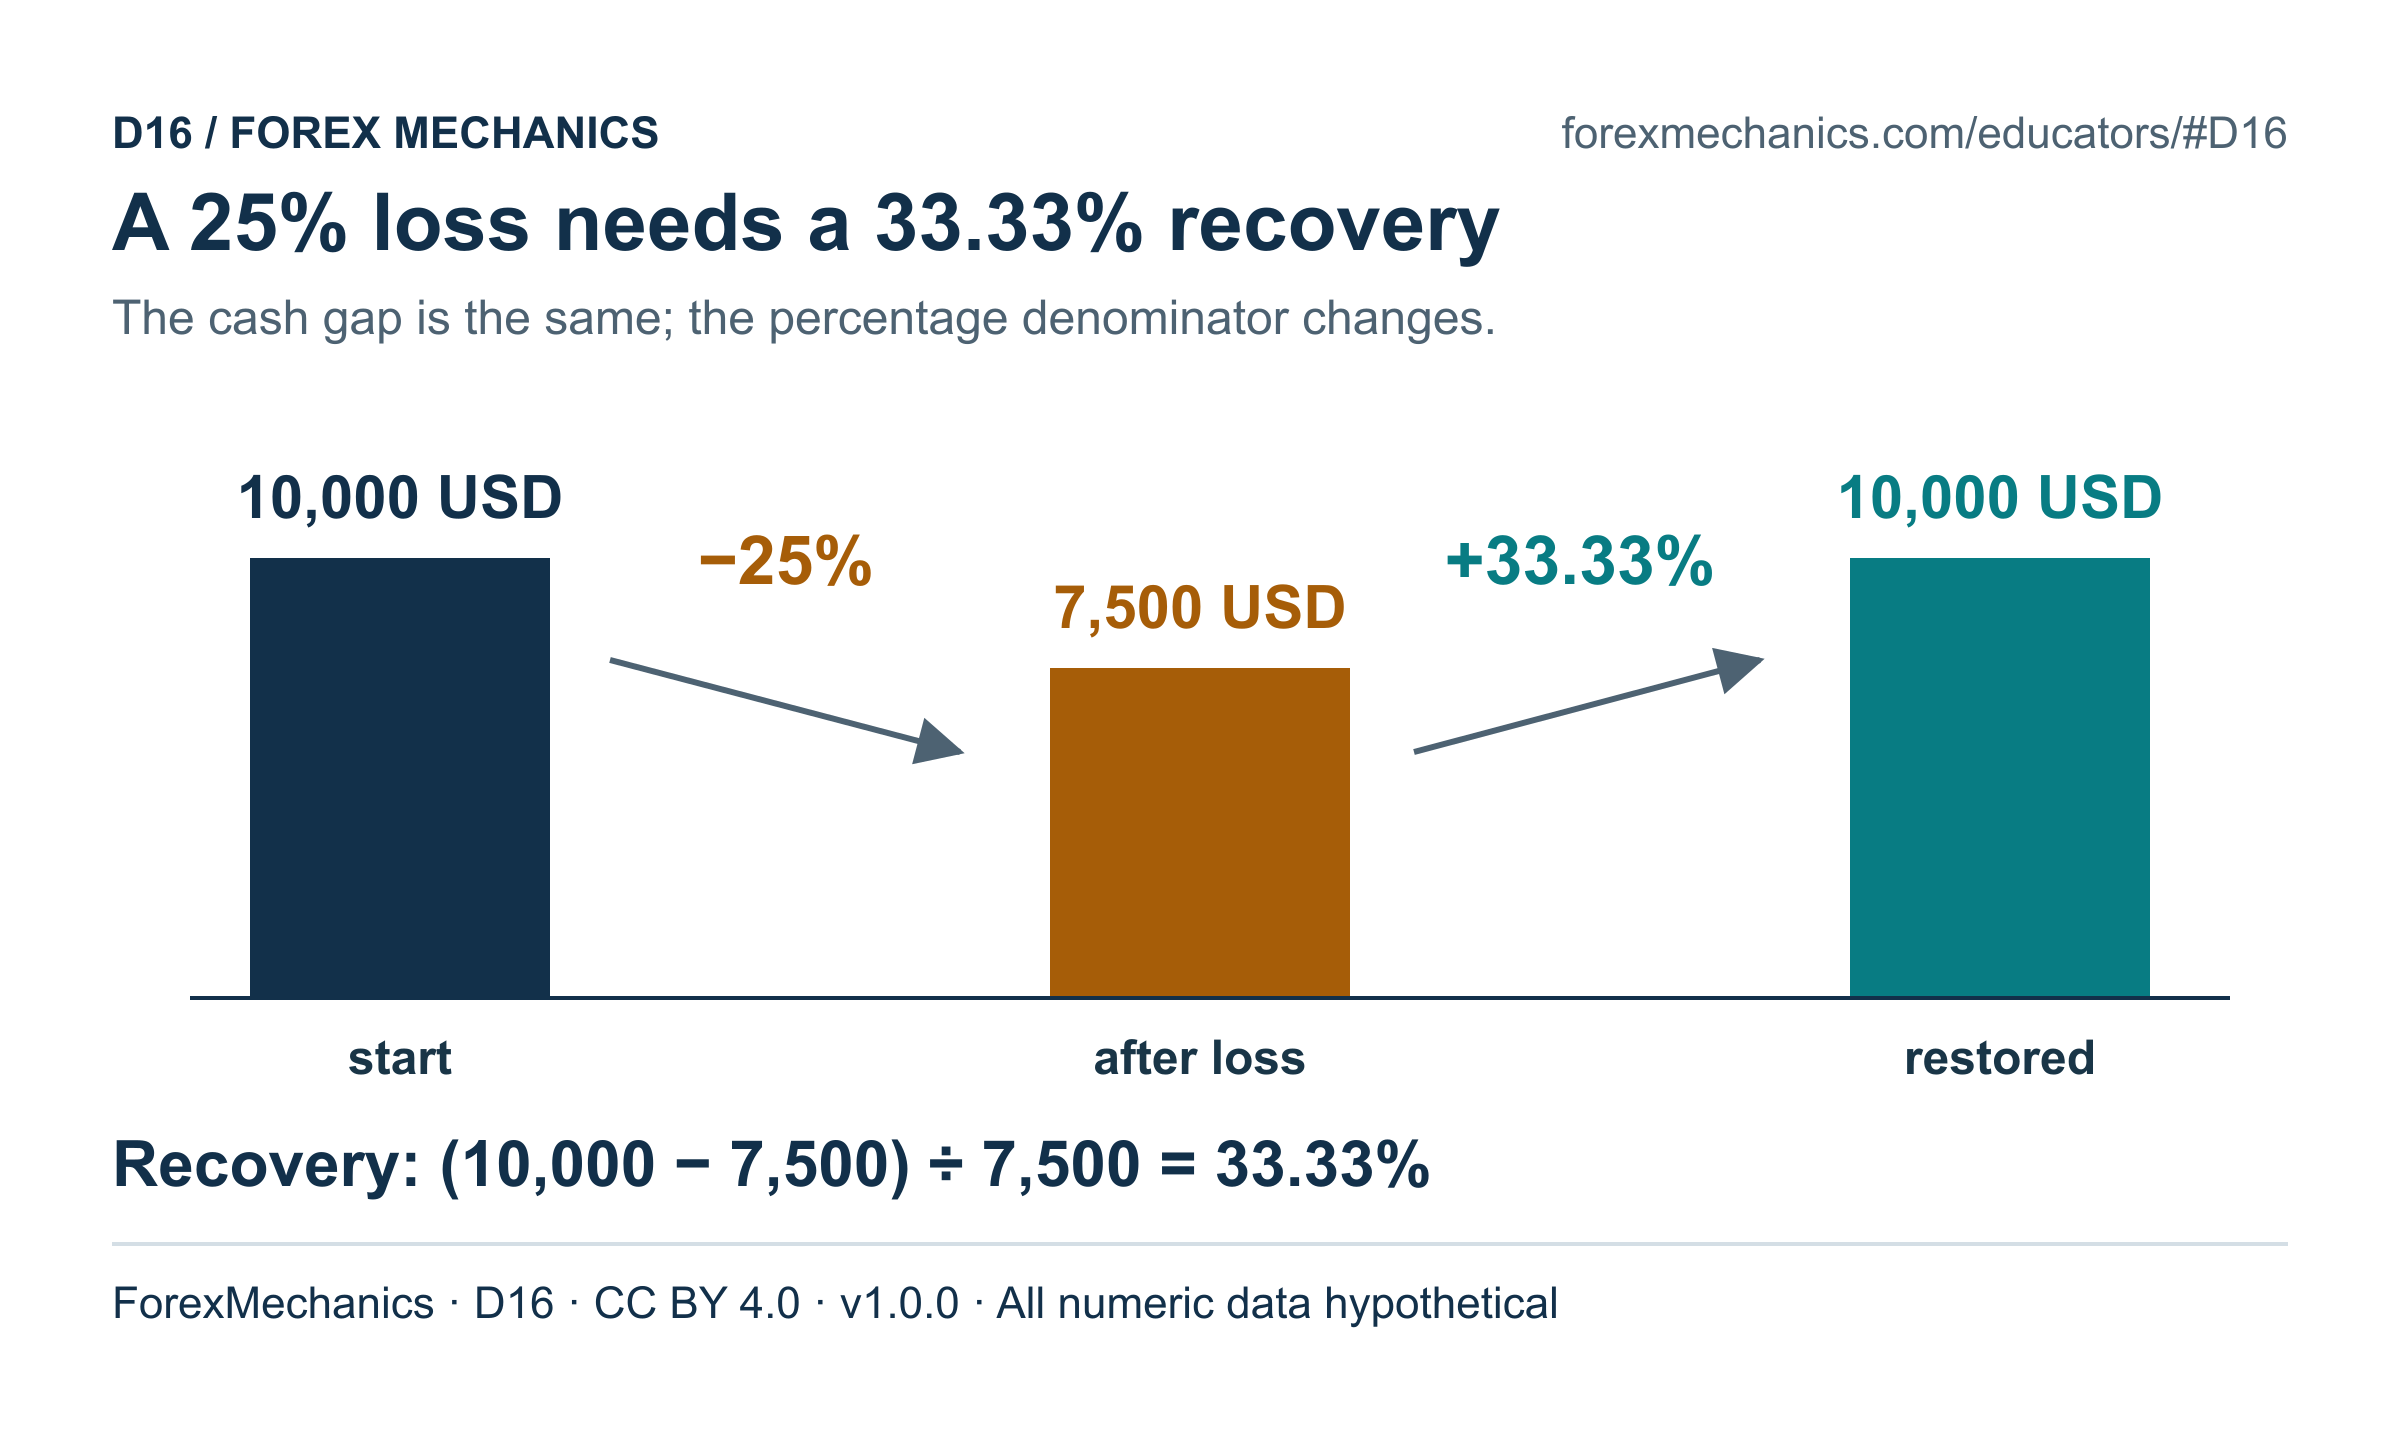
D16 · CC BY 4.0
A 25% loss needs a 33.33% recovery
Recovery percentage is measured from the remaining capital, with no deposits, withdrawals or forecast of attainable return.
Source credit
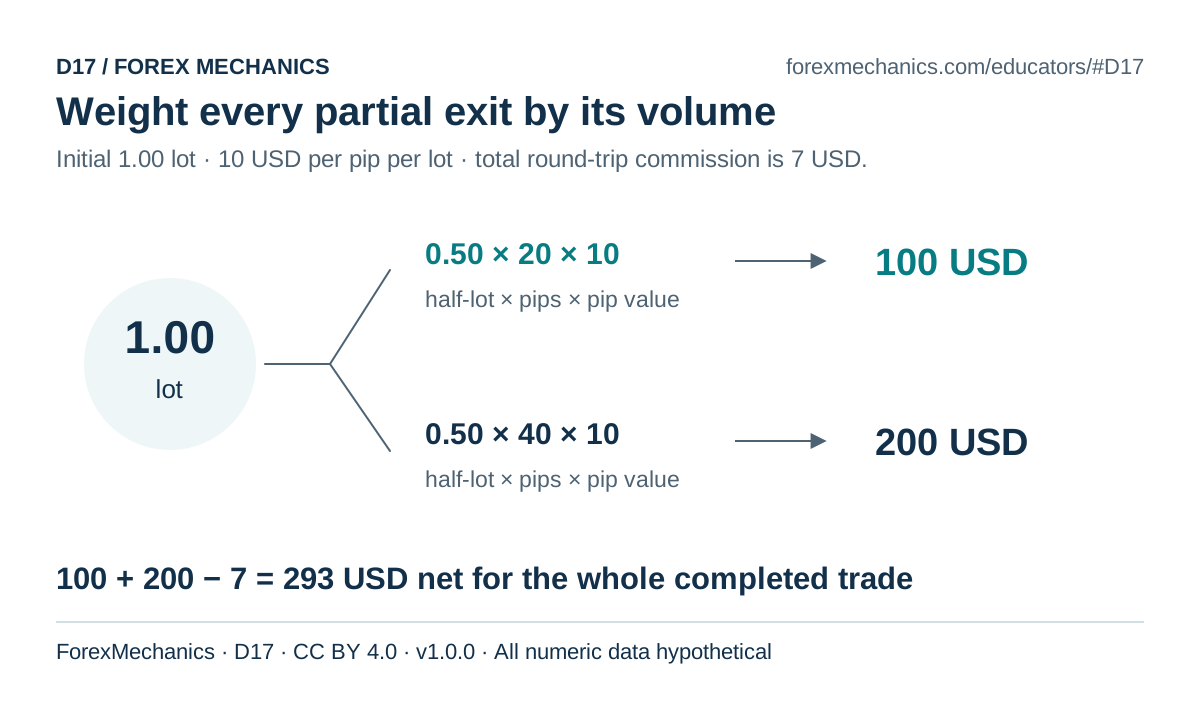
D17 · CC BY 4.0
Weight every partial exit by its volume
Each exit applies to half the original position. The stated 7 USD is the total round-trip charge, deducted once.
Source credit
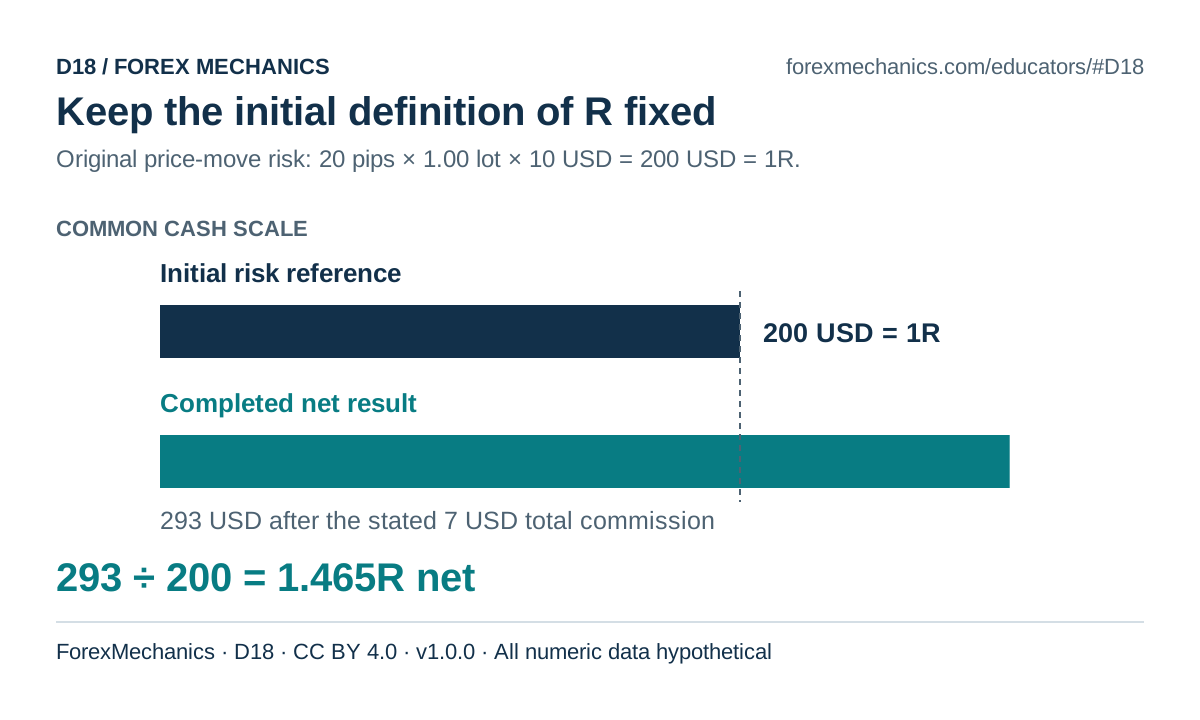
D18 · CC BY 4.0
Keep the initial definition of R fixed
Here 1R is defined before commission. Keep that stated denominator fixed when expressing the completed partial-exit result.
Source credit
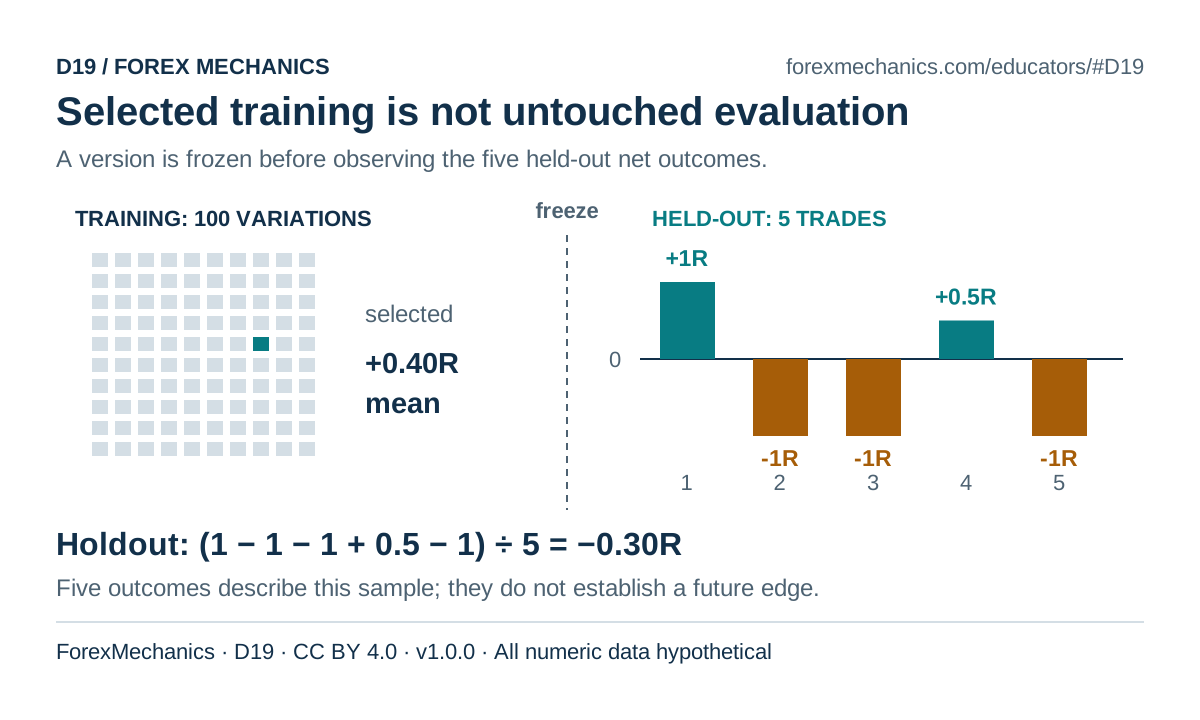
D19 · CC BY 4.0
Selected training is not untouched evaluation
Training selection and the descriptive mean of five invented held-out outcomes are separate statistics; neither establishes future expectancy.
Source credit
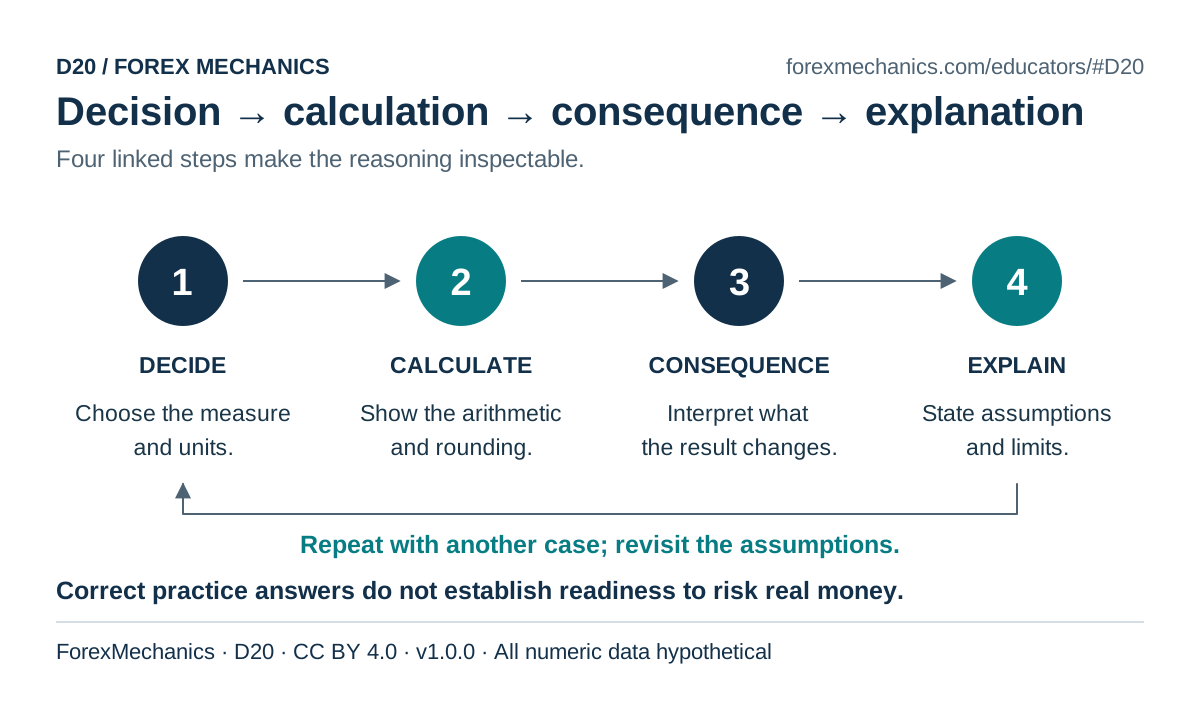
D20 · CC BY 4.0
Decision → calculation → consequence → explanation
The cycle checks understanding of a worked example. It does not establish readiness to trade real money.
Source credit
No diagram matches that search. Clear the field to see all twenty.
Ten exercises, connected to Decision Lab
Ask learners to write the decision, the number with its unit and one limit of the model. The student workbook contains the full inputs; interactive links below open feedback and worked answers online.
E01 - Sizing a yen pair for a euro account
Convert the pip value to the account currency and choose a tradable volume within a fixed risk budget.
Open interactive case and feedback · Open worksheet · Teacher solution
E02 - Execution costs and net expectancy
Convert a pip cost into R and deduct an additional cost consistently from before-cost expectancy.
Open interactive case and feedback · Open worksheet · Teacher solution
E03 - Shared dollar exposure
Calculate signed currency legs and distinguish common currency exposure from planned stop-loss budgets.
Open interactive case and feedback · Open worksheet · Teacher solution
E04 - Order of returns and maximum drawdown
Track current-equity compounding and measure drawdown against the running equity peak.
Open interactive case and feedback · Open worksheet · Teacher solution
E05 - Cleaning a mixed journal export
Define a valid completed-trade sample before calculating mean realised net R.
Open interactive case and feedback · Open worksheet · Teacher solution
E06 - Free margin and stop-loss risk
Convert a new position to account-currency notional, calculate its margin and include existing used margin.
Open interactive case and feedback · Open worksheet · Teacher solution
E07 - Realised loss after an adverse fill
Use a supplied actual fill distance and count the stated round-trip commission once.
Open interactive case and feedback · Open worksheet · Teacher solution
E08 - Recovery from a drawdown
Calculate a recovery percentage using the capital remaining after a loss.
Open interactive case and feedback · Open worksheet · Teacher solution
E09 - Net R across two partial exits
Weight partial-exit cash outcomes by volume and preserve the initial definition of one R.
Open interactive case and feedback · Open worksheet · Teacher solution
E10 - Evaluating a frozen strategy on held-out trades
Calculate a descriptive holdout mean while keeping training selection separate from untouched evaluation.
Open interactive case and feedback · Open worksheet · Teacher solution
Put a calculator beside your lesson
These three hosted widgets use the same calculation tools as ForexMechanics. Copy a snippet into an LMS or web page that permits iframes. They need an internet connection and follow the site privacy policy. A fixed-height embed is supplied; adjust the height to suit your layout.
Reuse the pack with a clear source credit
CC BY 4.0 applies to the original diagrams, exercise text, worked answers, lesson plans and printable handouts included in this versioned pack. You may share and adapt these materials, including for commercial use, under that license. Keep the supplied attribution and notices, link to the source and license, and describe changes. Do not imply endorsement.
This specific license does not grant rights to the rest of the website, its application code, third-party materials or trademarks. The widget snippets permit embedding the hosted calculators; they do not license the calculator source code. No additional permission is needed for the pack uses allowed by CC BY 4.0. See the full license text and the pack license notice.
The materials are supplied as-is without warranties. CC BY 4.0 permissions already granted remain in effect while its terms are met. Other course content follows the general reader-rights policy.
Download all source credits (CSV) · Download version and file hashes (JSON)
Verify the ZIP download
SHA-256 (ZIP, v1.0.0):
70fa07c9058e47954dd45b54a5f8c64d6b7fe16070ae43e8517d820093d17ddbMake the next version better
Found a missing assumption or a misleading diagram? Send the resource ID (for example D13 or E06), version and proposed correction through the contact page. Adapted translations are welcome under the pack license; identify them as adaptations and describe the changes.
Explore the full course · Open Decision Lab · Browse the toolkit