
Forex market size: what does $9.51 trillion a day mean?
Forex market size is usually measured by the value of new currency transactions agreed each day. In the latest BIS survey, this averaged $9.51 trillion a day in April 2025; the final tables appeared in June 2026. This is turnover, not a pot of invested money. To understand the number, follow one payment through two banks, then separate transactions, currencies and trading locations.

What is actually being counted?
Picture a company buying USD 100,000 to pay a supplier. Its bank may then make another currency trade to manage the position it has taken on. The payment is one business need, but it can generate more than one contract. That distinction is the starting point for reading FX turnover.
The Bank for International Settlements (BIS) coordinates a survey every three years. Its daily average adds the notional values of newly agreed OTC currency transactions, expressed in dollars, after specified duplicate reports are removed. Notional describes a contract’s size; it is not its price, margin deposit or possible loss. The same capital can support successive contracts. [1]
April 2025 is the measurement period; June 2026 is the final publication date. A current article can correctly use this survey without claiming it measured every day of 2026. Nor does an average mean that each day, currency pair or dealer had the same turnover.
One payment, two banks: why 180,000 becomes 140,000
This deliberately small example uses USD notionals. Bank A and Bank B both report to the survey; the company does not. The company agrees a USD 100,000 currency purchase with A. A separately hedges USD 40,000 with B. We assume these are the only contracts and reports in the example; the hedge amount is an assumption, not a rule for banks.
| Contract | Bank A reports | Bank B reports | Counted once globally |
|---|---|---|---|
| Company buys USD from A | 100,000 | — | 100,000 |
| A hedges with B | 40,000 | 40,000 | 40,000 |
| Total | 140,000 | 40,000 | 140,000 |
The raw reports add to USD 180,000. Removing the second report of the same interbank contract leaves USD 140,000 of turnover: 100,000 + 40,000. The company’s original payment remains USD 100,000.
The global net-net adjustment removes domestic and cross-border duplicate reports between reporting dealers. It does not collapse separate, genuine contracts back into a customer’s original need. Our case illustrates that principle rather than the entire BIS compilation procedure. A longer chain appears in the reporting-chain example. [2]
What does the $9.51 trillion include?
It includes spot transactions, outright forwards, FX swaps, currency swaps and OTC options. In the final April 2025 figures, spot accounts for 31.0% and FX swaps for 42.2%. The total is therefore much broader than purchases of currency for immediate spending. It is not a complete register of exchange-traded futures and options, currency-exchange services or every CFD. [1]
Turnover is a flow of newly agreed transactions over a period. Stock-market capitalisation is a value at a point in time; GDP is production over a period. Dividing turnover by either does not tell us how much capital is “inside Forex”. Likewise, the notional of a new contract and the money required when it settles answer different questions. The settlement section follows those differences.
Think back to the company and two banks: USD 140,000 describes contracts agreed. It does not mean a fund of USD 140,000 was permanently locked away, nor that somebody earned or lost that amount.
Where was the trade arranged? Use the location table’s own total
Geography introduces another distinction. The global total uses net-net, removing both domestic and cross-border interdealer duplicate reports. Sales-location tables use net-gross, removing domestic duplicates only. A cross-border interdealer contract can consequently contribute to two reporting locations. [1]
Suppose location A reports USD 6 million and location B USD 4 million after their domestic adjustments. Their combined net-gross total is USD 10 million. If removing cross-border duplicates gives a global net-net total of USD 8 million, A’s location share is still 6 ÷ 10 = 60%, not 6 ÷ 8 = 75%. Both totals can be correct; they answer different questions.
In the real survey, the United Kingdom, United States, Singapore and Hong Kong together account for 75.2% of sales-location turnover on its own basis. A desk location does not identify the nationality of the customer or the currency traded. The geography section gives the figures and definitions.
What can you infer before looking at a broker’s offer?
A large global turnover shows the scale of currency activity. It does not establish the price available for your amount, at your time, through your intermediary. A currency pair’s liquidity, the order size and the provider’s terms matter. It also does not demonstrate that retail trading is easy or profitable.
When reading a market-size claim, check four labels: the measurement, the period, the unit and the adjustment basis. Then ask whether it describes the whole market, one instrument, one currency or one location. If those labels differ, return to the source table before comparing the numbers. These checks are more useful than memorising the headline alone.
Try it yourself
Three exercises: the number, its meaning and its limits
The first two check the main explanation. The third is optional. Choose an answer or open the worked solution; it remains available without JavaScript.
Explore the details
Inside the BIS tables: methods, instruments and settlement
The small examples above explain how to read the statistic. The full discussion below adds survey collection, revisions, instruments, currencies, reporting locations and settlement risk. All published market figures refer to their stated observation period; the small cases are hypothetical.
Survey collection and the units in the source tables
Large numbers need the right units. In international financial English (short scale), one billion equals 109 (1,000 million) and one trillion equals 1012 (1,000 billion) — whereas under the continental European long scale, billion (or bilion) means 1012 and milliard means 109. The source table’s $9,510,240 million is therefore $9,510.240 billion, or $9.510240 trillion. Rounding it to $9.51 trillion preserves the scale, but does not replace the unrounded denominator when calculating shares.
How do thousands of reports become one number?
The BIS does not observe every order on a single screen. Central banks and other institutions in 52 jurisdictions took part in the April 2025 survey. They collected information from more than 1,100 banks and other dealers, then submitted national aggregates to the BIS. This is a large statistical exercise based on common reporting rules, rather than a record from one trading platform. [2]
A dealer assigns each new contract to an instrument, two currencies, a counterparty category and a sales-desk location. The trade date counts. A forward agreed in April enters April turnover even if payment is due in July. Conversely, settling in April a contract agreed in March is not, by itself, a new April transaction. [5, sections 2 and 5]
The report covers April transactions; calculating the daily average requires the appropriate number of business days in each country. A hypothetical dealer reporting $620 million in a month with 20 such days would have a daily average of $31 million. This does not mean that the dealer agreed contracts for exactly that amount every day. [5, section B.1.1]
A common reporting currency makes it possible to add EUR/USD, USD/JPY and other pairs. The BIS recommends converting notionals into dollars at the exchange rate on the trade date; where that is impracticable, the guidelines allow average or end-period rates. The value expressed in USD therefore depends on currency conversion as well as the number and size of contracts in their original units. [5, section C.2]
Central banks also provide information about survey coverage and concentration of turnover. A BIS table can consequently be revised after its preliminary publication. When comparing years, using a consistent data vintage matters more than the number of decimal places in an old press release.
How does the BIS remove double-counting?
If two banks reporting to the survey agree one transaction, each records it. Adding the reports without an adjustment would overstate turnover. The BIS applies two levels of adjustment. Net-net removes both domestic and cross-border duplicate reports between reporting dealers. The global $9.51 trillion is stated on that basis. Net-gross removes domestic duplicates only; it is used to compare sales locations. [1][2]
Hypothetical example: a London dealer agrees a $10 million transaction with a New York dealer. Each reports $10 million. In the global net-net total, it is one $10 million transaction. In the geographic net-gross breakdown, $10 million appears against the United Kingdom and $10 million against the United States. This explains why the geographic table’s sum exceeds the worldwide figure.
The adjustment concerns reports of the same contract. It does not remove subsequent, separate transactions in an intermediation chain. If a client buys currency from a bank and that bank separately hedges its position with another dealer, there are two contracts. Both may enter turnover.
One client need, several contracts
Let us extend the example. A company buys a hypothetical $10 million of dollars from dealer A in the United Kingdom. Dealer A agrees a separate contract for the same amount with dealer B in the United States. Dealer B then agrees another contract with dealer C in the United States. All three are assumed to be reporting dealers, the company is not, and every contract falls within the survey’s scope. Differences in exchange rates and costs are excluded.
| Contract | Raw reports | After net-gross adjustment | After net-net adjustment |
|---|---|---|---|
| Company — A | A: $10 million | $10 million against the UK | $10 million |
| A — B | A: $10 million; B: $10 million | $10 million against the UK and $10 million against the US | $10 million |
| B — C | B: $10 million; C: $10 million | $10 million against the US; domestic duplicate removed | $10 million |
| Total | $50 million | $40 million | $30 million |
The reports show $50 million, but three contracts with a total notional of $30 million were agreed. Net-net removes the second report of A–B and the second report of B–C. It does not remove any of the contracts because they all arose from the company’s original need. This is an intermediation chain, rather than one $30 million contract.
A different service arrangement can produce a different result. If a dealer matches opposing needs of two clients, it need not exchange currency with another bank. This does not alter the rules for counting agreed contracts. The survey describes participants’ activity; it does not reconstruct a single amount of “end-client money” underneath each transaction. [5, section 2]
Market-facing trades and operations that transfer risk
The BIS distinguishes contracts with clients and other unrelated participants that contribute to price formation (market-facing) from technical operations that transfer or reorganise risk (non-market-facing). Its survey commentary includes back-to-back trades linked to an original transaction, and trades created by portfolio compression, in the latter category. They enter total turnover and carry additional reporting flags. [2]
For example, a banking group’s local dealer serves a client, then transfers risk through a separate contract to another reporting entity in the group. In the statistics this may be both a new contract and an “of which: back-to-back” item. The guidelines exclude transfers between desks belonging to the same reporting dealer, however. Not every internal bank operation is additional turnover. [5, sections 2.1 and 8.1–8.2]
Compression replaces a set of offsetting contracts with fewer contracts, reducing the portfolio’s notional while preserving its net risk. New contracts created during the survey month are reported, even if their purpose is not a new directional position in a currency. [5, section 8.3]
Rows labelled “of which” are not additional components to add to the worldwide result. The same contract can be flagged as a related-party trade and as back-to-back. Adding those rows mechanically would count some contracts already included in the total again.
“Net turnover” therefore does not mean “new money brought into the market”. Nor does it mean the balance of purchases and sales, or participants’ profits.
Turnover growth and the exceptional April 2025
| Survey year | Daily turnover |
|---|---|
| 2013 | 5,357 |
| 2016 | 5,066 |
| 2019 | 6,581 |
| 2022 | 7,468 |
| 2025 | 9,510 |
Source: final BIS annex, Table 25.2; figures rounded to USD billion. [1] Interactive series: Table D11.1.
Turnover increased by about 27% from 2022. Comparisons should use the complete series from one final data vintage. Combining the preliminary 2025 figure with an earlier 2022 vintage produces a different percentage from comparing both revised values. The table also shows that turnover did not increase in every survey: the 2016 figure was lower than in 2013.
The rounded figures in the table give an increase of $2,042 billion a day: 9,510 minus 7,468. Dividing the difference by 7,468 gives approximately 27.3%, or 27% rounded to a whole percentage point. This compares two April measurements on the same basis. It is not an annual growth rate in every intervening year, nor the rate at which participants’ wealth increased. [1, Table 25.2]
Each point in the series is a separate monthly measurement. Between April 2022 and April 2025 there may have been quieter periods as well as greater surges in activity. A line joining points in a chart is not an observation of every intervening day. A longer series helps show the scale of changes, but analysing a specific episode requires more frequent data and information about transaction composition.
April 2025 was a period of heightened uncertainty after the announcement of US tariffs. The BIS analysis links increased activity partly to stronger demand for currency hedges. The turnover tables cannot, however, identify every contract’s motive or precisely separate the temporary effect of volatility from lasting market change. [3]
The BIS analysis describes two different investor responses: some reduced US assets; others retained those assets and increased protection against dollar depreciation. Selling an asset can create a spot conversion need; hedging a retained position increases demand for forwards or options. Both processes raise turnover, but they mean different things for an investor’s portfolio. The authors did not find signs of a dollar-funding squeeze comparable with a crisis shortage of dollars. [3]
This context explains why April was exceptional. It does not justify attributing the entire increase to one tariff decision or using the tables alone to calculate how many transactions reflected “fear” rather than a change in recurring financing needs.
This is a snapshot of one month. It should not be multiplied mechanically by 365 or described as a typical day in every year: trading days, conversion rates and activity change over time.

Why can turnover fall while the market is still needed?
The decline between the 2013 and 2016 surveys did not mean businesses had stopped paying foreign invoices. The BIS described reduced activity by some funds and trading firms, alongside more restricted access to prime brokerage. Banks changed fees and client requirements, and spot activity weakened. At the same time, FX swap activity associated with funding and hedging increased. One global number therefore concealed opposing changes in different parts of the market. [13]
This offers a useful way to read subsequent surveys. Start with the change in total turnover, then examine instruments and counterparties before looking for explanations in economic conditions and market organisation. It would be wrong to assume every group grew by the same percentage or that higher turnover solely reflected stronger demand from end clients.
Why do older articles quote $9.6 trillion?
The preliminary BIS release of 30 September 2025 reported about $9.6 trillion and growth of 28% from 2022. The final June 2026 annex gives $9.510240 trillion and approximately 27% growth on a comparable basis. These are successive versions of the survey, rather than two independent estimates of market size. A detailed final instrument table should not carry the earlier press release’s total. [2][1]
The longer history shows an even greater scale of change. The final annex reports approximately $1,239 billion for April 2001 and $3,973 billion for 2010, net-net. Before 2013, reporting coverage of some currencies was less complete. Historical levels can be shown, but dividing two distant observations is not a pure measure of growth in the same unchanged market. A higher notional can reflect increased activity, exchange-rate conversion and changes in survey coverage. [1, note to Table 25]
What is traded in the forex market?
| Instrument | Turnover | Share | What it enables |
|---|---|---|---|
| Spot | 2,951.8 | 31.0% | Currency exchange with a near settlement date. |
| Outright forward | 1,747.3 | 18.4% | Agreeing today the rate for one future exchange. |
| FX swap | 4,015.3 | 42.2% | Exchanging currencies and reversing the exchange at an agreed later date. |
| Currency swap | 164.1 | 1.7% | Exchanging financing cash flows in different currencies, often over a longer period. |
| FX options | 631.7 | 6.6% | The right to exchange on agreed terms in return for a premium. |
Source: final BIS annex, Table 1; shares calculated from unrounded values. Rounded shares total 99.9%; the BIS total also contains a negligible “other products” category. [1] Series: D11.1.

FX swaps make up the largest part of turnover. They can allow a bank to obtain dollars for a short period without permanently converting its euros. Short contracts are often renewed. Each renewal creates new turnover while the financing need remains similar. The survey does not add the two exchanges in one swap as two independent contracts.
Spot is approximately one third of the market. Imagining forex solely as “buying euros and selling dollars now” therefore misses many of its functions. An FX swap in this table is also different from the daily swap charge on a retail account. Financing and hedging applications are explained in the next lesson, Forex and the global economy.
How did turnover by instrument change from 2022 to 2025?
In the current BIS series, average turnover for the whole market increased by approximately 27.35%, but instruments did not all grow at the same pace. The table compares April 2022 with April 2025: both figures measure daily notional OTC FX turnover on a net-net basis, from the same current data vintage. Amounts and shares are different measures: a share uses the total for the relevant year, while growth is calculated from unrounded amounts.
| Instrument | April 2022 USD billion / share | April 2025 USD billion / share | Amount change |
|---|---|---|---|
| Spot | 2,085.3 27.9% | 2,951.8 31.0% | +41.5% |
| Outright forwards | 1,157.4 15.5% | 1,747.3 18.4% | +51.0% |
| FX swaps | 3,797.7 50.9% | 4,015.3 42.2% | +5.7% |
| Currency swaps | 123.8 1.7% | 164.1 1.7% | +32.6% |
| FX options | 303.3 4.1% | 631.7 6.6% | +108.3% |
| Total OTC FX | 7,467.5 100.0% | 9,510.2 100.0% | +27.4% |
Source: BIS Data Portal, Table D11.1, accessed on 29 October 2026 for 2022 and 2025 [14]. The 2025 amounts match Table 1 of the final June 2026 annex [1]. Calculations use unrounded amounts. Both totals include a negligible “other products” category not shown separately here; rounded shares of the five main categories sum to 100.1% and 99.9% respectively.
The older 2022 edition’s annex, revised within that release on 5 December 2022, reported USD 7,505,992 million for the whole market. The current series gives USD 7,467,541 million for the same April, approximately USD 7,468 billion in the historical table above. The instrument comparison uses one current series for both years, rather than mixing older amounts with a newer denominator. Exact amounts give total growth of 27.35% (27.4% rounded to one decimal place); the earlier 27.3% calculation used 9,510 and 7,468 rounded to whole billions. Rounding and revisions explain these differences, rather than a different turnover definition. [15] [14]
FX-swap amounts rose by 5.7%, although their share fell from 50.9% to 42.2%. There is no contradiction: the whole market grew faster than that category. Spot grew by 41.5%, outright forwards by 51.0%, and options by 108.3%, so the daily options notional more than doubled. This compares two survey months, without adjusting for inflation or changes in USD valuation; it is neither a return nor growth in client numbers. The exceptional conditions of April 2025 help explain the pattern, but the table alone does not establish individual trades’ motives. [3]
An instrument does not reveal its user’s complete intention
FX swaps and outright forwards together accounted for about 60.6% of daily turnover, or roughly 61%. This is a calculation from final notionals: $4,015.293 billion plus $1,747.311 billion, divided by $9,510.240 billion. Such a high share shows the importance of contracts involving future dates, but does not measure the share of hedging. [1, Table 1]
A company can buy spot currency for a particular invoice, so spot need not be speculation. An investor can use a forward to increase directional risk, while a bank can use an FX swap to obtain funding currency. The same structures serve different needs. The table divides turnover by instrument, rather than by the contracting party’s intention.
The two exchanges in an FX swap form one contract; the BIS requires it to be reported once, using the longer-dated leg. The first leg is not added to spot turnover. A currency swap providing financing cash flows in different currencies has a separate category. This distinction matters when reading charts: adding “every cash exchange” would produce a different measure from contract turnover. [5, section 5.1]
Higher swap turnover does not demonstrate greater safety either. A short contract can be renewed repeatedly, increasing the sum of new contracts while the funding amount remains similar. Access to the next round of financing, costs and counterparty risk require separate assessment.
Currencies, pairs and the 200% total
| Currency | Share of turnover by value |
|---|---|
| US dollar (USD) | 89.1% |
| Euro (EUR) | 28.5% |
| Japanese yen (JPY) | 16.9% |
| Pound sterling (GBP) | 10.2% |
| Renminbi / yuan (CNY) | 8.6% |
| Swiss franc (CHF) | 6.3% |
| Australian dollar (AUD) | 6.1% |
| Canadian dollar (CAD) | 5.8% |
Source: final BIS annex, Table 1; shares calculated from notionals. Full breakdown: D11.3. [1]
The shares of all currencies add up to 200%. Each contract has two currency sides. A hypothetical EUR/USD transaction worth $1 million increases total turnover by $1 million, turnover assigned to the euro by $1 million and turnover assigned to the dollar by $1 million. This is a data-presentation convention, rather than double-counting in the global total.
The dollar’s 89.1% is the share of transaction value with USD on one side. It is not a share of the number of orders. The currency-pair breakdown works differently: each trade belongs to one pair, so all pair shares add up to 100%.
| Pair | USD billion a day | Share |
|---|---|---|
| EUR/USD | 1,970.3 | 20.7% |
| USD/JPY | 1,370.1 | 14.4% |
| USD/CNY | 781.3 | 8.2% |
| GBP/USD | 715.5 | 7.5% |
Source: final BIS annex, Tables 3.9–3.10; shares calculated against $9,510.24 billion. Pairs are written in their usual market convention. [1] Breakdown: final-annex Tables 3.9–3.10.
A currency, a pair and an order count are three different breakdowns
The currency and pair tables can be read together. Turnover with USD on one side includes every dollar pair; EUR/USD is only one of them. The euro also appears in contracts against yen, sterling and other currencies. This is why EUR’s 28.5% share is greater than the 20.7% share of EUR/USD alone. [1, Tables 1 and 3.10]
Subtracting USD’s 89.1% from 200% does not give “turnover without the dollar”. Every dollar contract also involves another currency. Asking about contracts without USD requires a pair-based interpretation: with the dollar involved in 89.1%, about 10.9% of contract value had no dollar on either side. This is a share of notional across all OTC instruments, rather than of order counts or world assets.
EUR/USD’s high position in this table combines spot and derivatives. It does not answer how much of a particular spot market belongs to the pair, or how much can be bought at a stated price at a particular moment. Two days can have similar turnover but different available quote sizes and execution conditions.
De-dollarisation: which dollar function are we comparing?
A decline in the dollar’s reserve share does not contradict its large role in currency turnover. Reserves describe assets held by official institutions at quarter-end. FX turnover measures new transactions in the survey month. Invoices identify the currency in which goods are priced, while payment statistics identify the currency transferred through the network they cover. These are different questions, so their answers need not move together.
In its June 2024 analysis, the IMF associated the long-term decline in the USD reserve share with the growing role of several smaller currencies, including AUD, CAD, CNY, the Korean won, Singapore dollar and Nordic currencies. The lost share had not simply transferred in full to either the euro or renminbi. Easier trading and custody of assets expand opportunities for diversification. This is an interpretation of a particular historical study, not proof of one motive shared by every central bank. [7]
The dollar can remain a vehicle currency at the same time: to exchange two less liquid currencies, a dealer can use their markets against USD. Consider a hypothetical example with no particular exchange rate assumed. A business needs currency B and holds A; an intermediary may obtain B through A→USD and USD→B if that route is available and advantageous. It may instead execute directly or offset the need against another client. The indirect route creates more dollar contracts, although neither buyer nor seller operates in the United States.
This does not produce a forecast that the dollar will always dominate. Changing established practices requires more than declarations: alternative-currency markets for assets, payments, funding and hedging must be accessible. Reserve comparisons also need a consistent data vintage and a distinction between transactions and valuation. If the euro strengthens against the dollar, the dollar value of an unchanged EUR holding rises; the USD share may fall without any sale of dollar assets.
The most precise conclusion is therefore that a particular dollar function changed over a specified period. The CNY share of 8.6% in turnover alone does not identify how much business came from trade in goods, funding or speculation. Complete COFER data, invoicing and a valuation-effect example appear in the next lesson. Here, they help separate measures rather than replace a turnover table with a political interpretation.
Where are trades reported?
| Location | Turnover | Share of the geographic total |
|---|---|---|
| United Kingdom | 4,742.6 | 37.8% |
| United States | 2,334.7 | 18.6% |
| Singapore | 1,485.3 | 11.8% |
| Hong Kong | 883.1 | 7.0% |
| Japan | 440.2 | 3.5% |
| Other locations | 2,671.3 | 21.3% |
| Total | 12,557.1 | 100.0% |
Source: final BIS annex, Table 1. Shares and “other locations” calculated from the source table. [1] Country details: D11.5 — countries and instruments, net-gross.
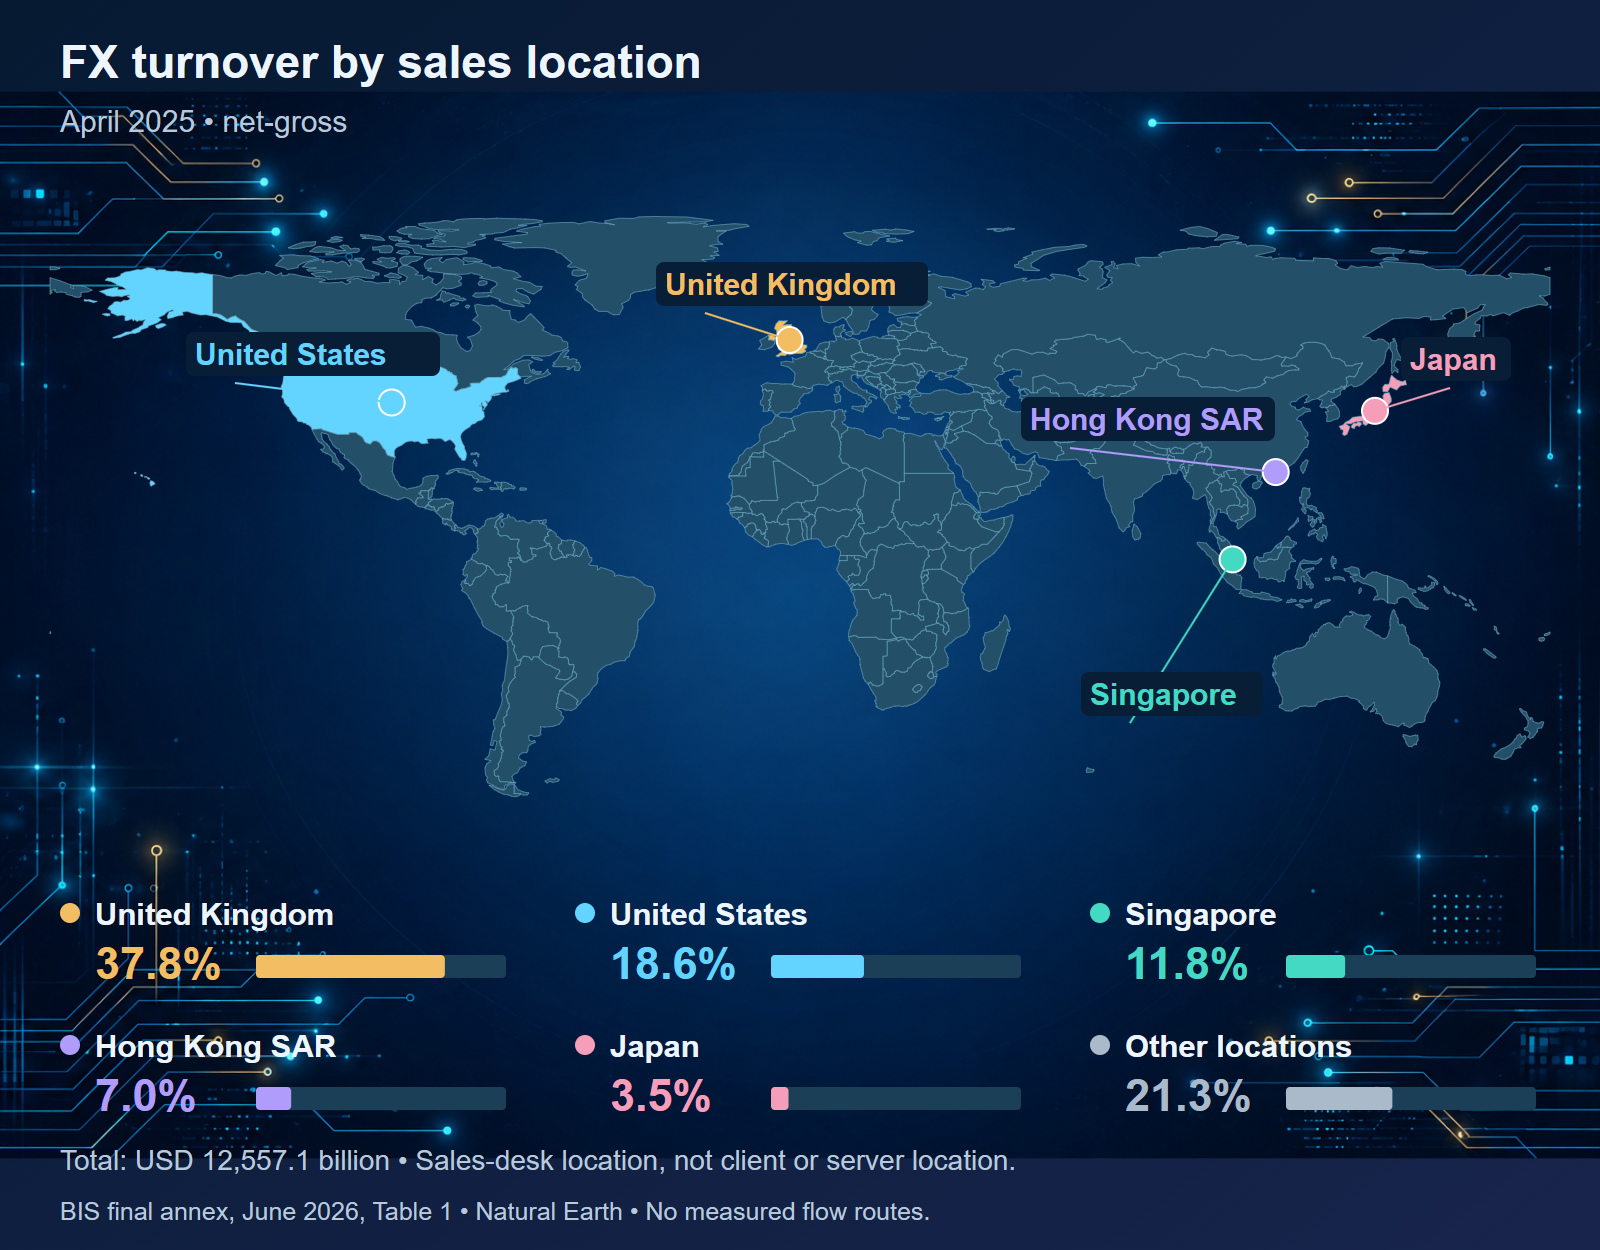
Geography refers to the sales desk. This is the location of the unit arranging a trade, not necessarily the client’s headquarters, the bank’s nationality or a physical server. A continental European company served by a London banking desk can be assigned to the United Kingdom.
We do not divide the UK’s $4.74 trillion by the global $9.51 trillion to calculate its share. Cross-border interdealer transactions remain in both locations in the geographic table. The relevant denominator here is $12.56 trillion.
The same order from an overseas client can be served by a UK desk, executed through a system operating elsewhere and booked at the bank’s headquarters. The turnover survey selects the sales-desk location. Where an electronic trade has no such desk, the guidelines refer to the platform’s sales contact serving the client. The map therefore shows market service under a defined rule, rather than the physical route of banknotes. [5, section 2.1]
The United Kingdom is the statistical unit here. London is an important centre, but the country table does not separate its turnover from that of other UK desks. Nor does it establish that one city sets the exchange rate or owns a corresponding share of the world’s currencies.
Why do so many desks serve transactions from London?
London’s importance is associated with the concentration of banks, clients, specialised services and infrastructure, and its convenient position in the daily trading cycle. London business hours overlap partly with Asian activity and later with American activity. There is no need to assume one UTC schedule throughout the year: the UK and US change clocks, not always on the same dates.
This explains the organisation of market services, rather than proving that London determines the only true price. An international bank can serve currencies and clients from many countries in one centre. A country with a large sales-table share need not have an equally large economy or an equally frequently used domestic currency. The BIS table alone does not isolate the contribution of time zones, financial history and technology, nor assign each a percentage of that advantage.
History helps explain how that cluster developed. The Bank of England was established in 1694; London had been developing banking services and international trade finance long before modern FX platforms. [10] Today, clients benefit from the proximity of counterparties, specialists and infrastructure: serving a global portfolio is easier where a bank already has relationships and operational support. The length of that history alone does not numerically explain its present share.
A London reference point is not one price for the entire market
A financial centre’s role is also visible in valuation methods. WMR publishes closing spot benchmarks for 4 pm London time. A portfolio manager can use a defined benchmark to compare asset values across dates rather than select an arbitrary price from an arbitrary platform. London time does not correspond to one fixed UTC time throughout the year. [8]
A different example is the IMF’s valuation of special drawing rights (SDRs). Its procedure uses mid-market rates provided by the Bank of England, observed around noon in London, with backup providers specified by the IMF. [9] This is neither the WMR 4 pm measurement nor a price at which every client can exchange currency.
Consider a hypothetical use: a fund holds foreign equities, while its units are valued in its domestic currency. A consistent conversion time and method make valuations more comparable. Its currency order may execute earlier or later and at a different price; market movement must then be distinguished from execution costs. A BIS table measures transaction activity, a benchmark supplies a defined reference price, and the client’s result also depends on the contract. These are three connected but separate questions.
Singapore and cross-border transactions
Singapore ranks third among sales locations. Together, the first four account for about 75.2% of net-gross turnover. Concentrated service in a few centres does not mean their residents own that proportion of market capital.
In the global counterparty breakdown, cross-border transactions represented about 65.3% of turnover by value, net-net. “Cross-border” describes the relationship between the dealer’s and counterparty’s locations. This asks a different question from where a trade is served, and from international trade in goods. [1]
Compare centres using one table. The final figures show that Singapore reported about $162.0 billion more per day than Hong Kong and Japan combined: 1,485.282 minus 883.067 minus 440.231. Germany reported $386.1 billion and France $242.2 billion a day. These are sales-desk locations, not cities or the shares of their countries’ currencies. [1, Table 1]
A Singapore dealer may serve USD/JPY clients although neither currency is Singaporean. Similarly, a European fund may use an Asian desk during local business hours. Growth in a centre can reflect a reorganisation of client service, changing client needs or changes in instrument activity. A geographic ranking does not isolate those causes or show that the reporting country’s economy has acquired that share of world trade.
Market case: sterling’s sharp move in October 2016
On 7 October 2016, around 00:07 UK time, sterling weakened sharply during early Asian trading. The BIS Markets Committee report identifies interacting factors including limited market depth, automated responses, stop-loss orders and options-related flows. It does not establish one exclusive cause. [6]
Executed transactions increased turnover while execution conditions could deteriorate sharply. Activity and available liquidity are different: during a rapid move, quotes disappear or change and subsequent orders encounter a shallower market. The episode does not prove that every Asian session is illiquid. It shows why a worldwide average cannot describe a specific pair’s conditions in a specific minute.
Who is on the other side of a transaction?
| BIS category | Turnover | Share |
|---|---|---|
| Reporting dealers | 4,442.7 | 46.7% |
| Other financial institutions | 4,626.6 | 48.6% |
| Non-financial customers | 440.9 | 4.6% |
Source: final BIS annex, Table 1. Rounding means the shares do not add up exactly to 100%. [1] Breakdown: D11.4 — instruments, counterparties and maturity, net-net.

The first category covers trades between participating dealers. The second is broad: it includes non-reporting banks, institutional investors, hedge funds and specialised trading firms. Non-financial customers include businesses. This is a counterparty classification, rather than a ranking of speculators and those who “need currency”. [2]
A small direct share for non-financial customers does not mean forex has a small economic role. A company’s order can trigger further intermediary operations. Conversely, a high share for financial institutions does not show that their transactions are unrelated to clients’ trade or investments.
“Other financial institutions” means institutions outside the reporting-dealer list, rather than small or less professional firms. Official financial institutions, including central banks, sit within this breakdown. Adding them as a fourth separate sector would count some turnover again. [5, section 1]
Even a detailed counterparty table is not a register of ultimate owners of money. A bank’s direct counterparty can be an intermediary serving further clients. This distinction matters when asking about retail trading or how much of the market “belongs” to companies.
Prime brokerage and business needs: two different breakdowns
In the final table, prime brokered turnover was $2,163.1 billion a day, or approximately 22.7% of total turnover. This is an additional access-related designation, not a fourth counterparty group. It must not be added to the three rows in the earlier table. Spot accounted for $1,281.2 billion, outright forwards $370.7 billion and FX swaps $312.6 billion of that amount; the remaining instruments are also included in the total. [1, Table 1]
A prime broker allows an eligible institutional client to transact with other dealers within its credit relationship and agreed limits. A fund can compare prices from several providers and organise transaction-related obligations through one partner. This does not mean any client can obtain every price without restrictions. Changes in limits or access may reduce activity without changing the need to hedge a portfolio. The access mechanism is also explained in the BIS analysis [13].
Non-financial businesses, by contrast, record different activity across instruments: in April 2025, spot turnover was $144.4 billion a day, outright forwards $84.5 billion and FX swaps $148.9 billion. [1, Table 1] A record total does not imply a record for every business category and contract type. Measuring change for this group would require comparable figures for both years, rather than the growth rate of the whole market.
Consider a hypothetical exporter receiving euros monthly but facing larger euro expenses only after a quarter. It can retain part of its receipts, convert part and hedge some future needs with a forward. Two companies with identical export sales may therefore have different spot and derivatives turnover. A dealer can also offset opposing client needs instead of hedging each separately with another bank. Turnover measures contracts, not a complete map of businesses’ ultimate exposures.
Where are regional currencies — and where is retail trading?
Major currencies dominate the top of the table, yet regional currencies still generate substantial daily turnover. Take the Polish zloty (PLN) as a benchmark Central European example: in April 2025, turnover across OTC instruments with PLN on one side averaged approximately $76.3 billion a day, or 0.8% of global turnover. That is worldwide activity involving PLN (again under the 200% currency-total convention), not solely deals executed in Warsaw. [1, Table 2.11]
The global figure cannot tell us what spread a specific spot client will receive. Within one currency, conditions differ across spot and forward instruments, times of day and order sizes.
The $76.3 billion is a dollar conversion of contracts involving PLN, not the amount of dollars actually exchanged for zloty in every contract. It spans multiple crosses and derivatives. Evaluating EUR/PLN spot requires looking at that pair and instrument rather than the total of all PLN operations. Likewise, local trading-desk turnover covers all currencies booked in a country and differs from separate interest-rate derivatives statistics.
The BIS also flags some turnover as retail-driven. This is not a complete statistic for every CFD account or the sum of its profits and losses. A broker may offset some client positions internally. The connection to a retail account is explained in the lessons on retail forex trading and execution quality.
The final BIS table reports $241.99 billion of retail-driven average daily turnover in April 2025, net-net: about 2.5% of the total. It should be quoted with its definition: dealer-reported trades initiated by individuals conducting speculative, leveraged, cash-settled currency transactions on their own account. The guidelines cover direct contact and retail-platform intermediation, but exclude ordinary card payments, remittances and exchange conducted in commercial activity, among other items. [1, Table 1][5, section 8.5]
This does not mean every transaction on brokers’ client accounts was individually added to the worldwide total. A dealer sees its relationship with a platform or client, and reporting coverage and quality have limits. The row is an additional flag within turnover, so we do not add $241.99 billion again to $9.51 trillion. It cannot give us the number of traders, average account balance or percentage of profitable clients.
EUR/GBP and EUR/USD: the same function, different execution conditions
A UK treasurer buying euros and a US treasurer paying a euro invoice have similar needs: obtain the payment currency. However, they use different pairs and offers. Total turnover in all instruments involving GBP or EUR is not the spot turnover of a single pair, and the EUR/USD total in the earlier table also includes derivatives. Comparing those totals does not determine the spread or price available to a particular client.
In a hypothetical UK importer example, bank A quotes EUR/GBP at 0.8500/0.8506 for EUR 100,000, while bank B quotes 0.8501/0.8505. To buy euros, the client uses the bank’s selling price. With no additional fees, the payment is GBP 85,060 at A or GBP 85,050 at B: a GBP 10 difference. Assume the same time, amount and delivery date, with both quotes executable for the full amount. Both quote midpoints are 0.8503, but that is not the euro purchase price.
If bank B makes that price available for only EUR 10,000, calculating the cost of EUR 100,000 requires further offers. A different time, limit or delivery date may change the terms. This example is neither a bank ranking nor evidence of a typical EUR/GBP cost. It shows how to move from a global statistic to a comparison of actual services without assuming a large market supplies every amount at the screen price.
Turnover, settlement and exposure are different measures
Exposure means vulnerability to a change in value or failure to fulfil an obligation. Turnover sums contracts agreed over a period; outstanding contracts describe a stock on a stated date. Neither amount is automatically a loss.
A hypothetical investor buys €1 million for dollars and later sells the same €1 million. Both operations increase daily turnover, even if the investor no longer has a euro position afterwards. Calculating the result requires the rates, timing and costs.
A simple calculation makes this clear. Buying €1 million at EUR/USD 1.10 means $1.10 million of notional; selling at 1.11 means $1.11 million. Total turnover is $2.21 million, while receipts minus expenditure equal $10,000 before costs. The euro position is closed after both exchanges. Neither $2.21 million nor $10,000 defines the deposit needed to conduct these operations.
Settlement fulfils the payments arising from contracts. Amounts to be delivered can differ from new-contract turnover because of maturities, the two exchanges in swaps and offsetting obligations. BIS settlement data are therefore a separate dataset. Payment-versus-payment (PvP) makes delivery of one currency conditional on delivery of the other and limits the risk of losing the full amount owed, but does not remove every liquidity or replacement-cost risk. [4]
If two parties owe currencies to each other on the same day, a netting agreement can reduce the payments. This is separate from net-net reporting adjustments: netting changes what must be delivered; the BIS adjustment removes a duplicate report of one contract. Turnover guidelines count new contracts before such netting, rather than substituting the amount paid into a settlement system for turnover. [5, section 2][4]
There is no single standard “forex capitalisation” corresponding to stock-market capitalisation. Money supply, outstanding contracts and reserves can be measured, but they are separate stocks. Similarly, “forex is X times larger than equities” requires a common definition, period and scope. Without them, an impressive ratio explains little.
Why does settlement need its own measurement?
On 26 June 1974, Bankhaus Herstatt’s closure stopped dollar payments after some counterparties had already delivered Deutsche marks. This created the risk of losing the amount delivered, rather than merely an adverse exchange-rate movement. That timing asymmetry underlies “Herstatt risk”. CLS, launched in 2002, is one system that addresses it through PvP; it is neither a central exchange nor a counterparty replacing every FX participant. [4]
In the new BIS measurement for April 2025, about 36% of daily settlement obligations by value used PvP, approximately 54% used methods that mitigate rather than eliminate risk, and about 10% — more than $1.4 trillion a day — settled gross bilaterally. This describes amounts to be settled, rather than a breakdown of $9.51 trillion in new contracts. The methodology changed from earlier estimates, so the last figure cannot be compared directly with old headlines about all non-PvP settlement. [4, Table 2]
A high notional settled through a system is not the amount of cash participants simultaneously pay into it. Netting and liquidity management can reduce funding requirements. Reducing cash needs, adjusting BIS reports and eliminating the risk of losing delivered currency are three separate effects. One cannot serve as a numerical substitute for the others.
Netting reduces funding; PvP protects the currency exchange
Settlement does not arbitrarily offset euros against dollars. A simple hypothetical model concerns only same-day USD payments: bank A owes B $10 million, and B owes A $8 million. If an enforceable arrangement permits netting, A pays B the remaining $2 million. The economic history of two obligations remains, as does the risk that the remaining payment is not made.
With several banks, each participant’s net position can be calculated separately for a currency. Consider another hypothetical model: A pays B $10 million, B pays C $8 million, and C pays A $6 million. A is a net payer of $4 million; B and C each receive $2 million. The three instructions total $24 million, while the net payer’s funding totals $4 million. That result depends on this particular network of obligations; it is not a universal reduction percentage. Actual arrangements require appropriate legal rules, deadlines and funds in the correct currencies.
CLS combines multilateral netting of funding requirements with PvP. The operator reports a reduction in funding requirements exceeding 96% for its service. This percentage must not be applied to all global payments or to a contract’s market risk. Pay-ins, instruction values and protection against delivering one currency without receiving the other describe different effects. [11]
The CLS currency list includes 18 major and selected emerging-market currencies such as the Mexican peso and South African rand, while excluding non-CLS currencies such as PLN. [12] However, that does not mean every contract outside CLS settles with no mitigation, or every contract in an eligible currency actually uses PvP. Counterparty access, contract type, timing and the delivery method also matter. Other risks, including liquidity shortfalls or replacement costs after a failed contract, need separate consideration.
What do these data tell market users?
The survey shows the scale of intermediation, the dollar’s importance and the concentration of services. It also helps explain why short-term financing generates so much turnover, and why a huge notional is not a huge pool of money waiting for traders.
Liquidity must be assessed for a particular trade. It concerns the ability to execute a stated size at a stated time without substantially worsening the price. A worldwide average does not describe quote depth at an economic release or a broker’s conditions. The lesson on intraday liquidity concentration explains how those conditions vary.
When reading any subsequent table, check four things: what has been summed, the data period, which duplicates have been removed, and the denominator of each share. These usually explain differences between two valid charts better than adding a story about “capital flight”.
Two headlines can sound similar: “Market turnover: $9.51 trillion a day” and a hypothetical “Investor’s portfolio: $10 million at month-end”. The first sums new contracts during a day; the second describes assets held at one moment. Dividing them measures neither that investor’s share of the global market nor growth in the portfolio.
Questions and answers
What is daily forex turnover?
According to final BIS data, average daily OTC FX turnover in April 2025 was $9.51 trillion. This covers one survey month and was published in final form in June 2026; it does not measure every day of 2026.
Why do forex currency shares add up to 200%?
Every transaction involves two currencies. The BIS assigns its value to both, so all individual currency shares add up to 200%. Currency-pair shares add up to 100%.
Is $9.51 trillion money available in traders’ accounts?
No. It sums the notional values of transactions agreed during an average day of the survey month. It is not total deposits, investor capital or outstanding positions.
Why is FX swap turnover greater than spot turnover?
FX swaps serve purposes including obtaining currency temporarily and managing liquidity. Many have short maturities and are renewed. Turnover sums successive new contracts, increasing without an equal rise in capital committed at one time.
Does the United Kingdom account for 37.8% of global forex turnover?
The United Kingdom has a 37.8% share in the BIS geographic table. Data are assigned to sales-desk locations and use the net-gross basis. This is neither a share of British clients nor a share calculated by dividing UK turnover by the global $9.51 trillion.
Does enormous turnover guarantee a good broker price?
No. Execution depends on the pair, time, order size, market conditions and the broker’s execution arrangements. Global BIS statistics do not describe the cost or quality of one retail trade.
Why does London serve so many currency transactions?
It overlaps part of the Asian and US business day and concentrates banks, clients and operational infrastructure. The United Kingdom’s share in the BIS table refers to sales-desk locations, not the city alone or one proven cause of its advantage.
Does the exceptional April 2025 invalidate the survey?
No. The survey measures actual contracts in that month, which was a period of elevated volatility and changes in hedging. Its result should not be treated as a typical day in every year or its entire growth attributed to one tariff announcement.
Can the dollar lose reserve share while remaining dominant in FX?
Yes. Reserves are a stock of official assets; turnover sums new contracts. The dollar may be widely used as a vehicle for exchanging other currencies while reserve managers diversify portfolios. Comparisons must specify the function, period and valuation effects.
Why does franc turnover not prove safe-haven demand?
The CHF share of 6.3% measures the value of transactions involving francs on one side. The table alone does not separate hedging, funding, speculation or payment motives. Calling a currency a safe haven does not give every contract the same purpose.
What is CLS, and what does it not guarantee?
CLS is settlement infrastructure combining PvP with funding-efficiency arrangements. It supports 18 currencies, including major pairs plus selected emerging currencies such as MXN and ZAR, while excluding non-CLS currencies such as PLN. It is neither an exchange nor a guarantee of profits, market liquidity or the absence of replacement risk after a failed contract.
How much settlement remains fully exposed to Herstatt risk?
In the new BIS survey for April 2025, more than $1.4 trillion a day, about 10% of settlement obligations, settled gross bilaterally. Approximately 36% used PvP and 54% used methods mitigating but not eliminating risk. This is a separate measurement, not a breakdown of $9.51 trillion in turnover.
Sources and data coverage
Verified on 12 October 2026. The 2025 turnover figures come from the final BIS publication of June 2026; the instrument comparison with 2022 uses the current common BIS Data Portal series, accessed on 29 October 2026. The article does not use the preliminary $9.6 trillion result or preliminary currency shares. Calculated shares and rounding are identified beside the tables.
- BIS, Triennial Central Bank Survey 2025 — final statistical annex, June 2026 (PDF). Tables 1, 2.11, 3.9–3.10 and 25.2: instruments, currencies, pairs, counterparties, geography and the historical series. Net-net basis; geography: net-gross.
- BIS, OTC foreign exchange turnover in April 2025, 30 September 2025. Used for category definitions and methodology; its preliminary figures are replaced by the final annex.
- Huang W., Krohn I., Sushko V., BIS, Global FX markets: when hedging takes centre stage, December 2025. Context for activity and hedging in April 2025.
- BIS, Uncovering FX settlement risk: new measures from the 2025 BIS Triennial Survey, June 2026. Turnover, settlement obligations and payment-versus-payment protection.
- BIS, Reporting guidelines for turnover in April 2025 (PDF), accessed 29 October 2026. Sections 1–2, 5.1, 8.1–8.5, B.1.1 and C.2: turnover, location, instruments, related operations, retail-driven activity and USD conversion.
- BIS Markets Committee, The sterling “flash event” of 7 October 2016, January 2017. The event and interacting liquidity factors; differing price lows are not treated as one market-wide rate.
- IMF, Dollar Dominance in the International Reserve System: An Update, 11 June 2024. Reserve diversification and limits on interpreting motives.
- LSEG, WMR FX Benchmarks, accessed 29 October 2026. Closing spot benchmarks at 4 pm London time.
- IMF, SDR Valuation, footnote 2, accessed 29 October 2026. Exchange-rate inputs around noon London time.
- Bank of England, Who owns the Bank of England?, accessed 29 October 2026. Establishment in 1694.
- CLS, CLSSettlement, accessed 29 October 2026. Multilateral netting and the service’s reported funding reduction exceeding 96%; not a statistic for all FX settlement.
- CLS, Currencies, accessed 29 October 2026. Actual list of 18 currencies, including MXN and ZAR.
- Moore M., Schrimpf A., Sushko V., BIS, Downsized FX markets: causes and implications, December 2016. Spot, swaps and changes in prime-broker access; a historical-period analysis.
- BIS Data Portal, D11.1 — Turnover of OTC foreign exchange instruments, 2022 and 2025, accessed on 29 October 2026. One current series, net-net, USD million daily in April; shares and growth calculated from unrounded amounts.
- BIS, OTC foreign exchange turnover in April 2022 — Annex tables, tables revised on 5 December 2022. Table 1 documents an older edition with a total of USD 7,505,992 million; it is not the source of the amounts in the new instrument comparison.