
Currency pair classification: majors, minors, crosses and exotics
Majors, minors and exotics are market labels for groups of currency pairs. A cross usually means a pair without USD, so the categories can overlap. Use three pairs and a EUR 5,000 payment to learn what a label tells you, what it leaves out and how to compare an actual offer.

Three symbols, several different questions
Imagine a small business owner looking at a platform with three symbols: EUR/USD, EUR/GBP and EUR/PLN. One concerns an incoming dollar payment, another a British supplier, and the third a euro bill funded from zlotys. The useful starting point is the currency need, not a ranking of which symbol sounds most prestigious.
| Pair | Common description | What this identifies |
|---|---|---|
| EUR/USD | Major | One of the seven conventional major USD pairs. |
| EUR/GBP | Cross; often called a minor | No USD; both currencies are among the widely traded developed-market currencies. |
| EUR/PLN | Cross; often called exotic | No USD, and PLN lies outside the usual FX G10 set. |
These descriptions are conventions, not a single universal standard. In this lesson “majors” refers to the classic seven USD pairs, while “cross” means a pair without USD. “Minor” is less consistent across providers. EUR/PLN can be both a cross and an exotic: those labels answer different questions, so there is no contradiction.
A category does not calculate the cost of a payment
Suppose that same business needs to buy EUR 5,000 using USD. Two providers confirm the full amount, identical settlement timing and no charges other than those listed below. All figures are hypothetical; the ask is the provider’s euro selling price.
| Offer | Ask, USD per EUR | Additional fee | Total USD debit |
|---|---|---|---|
| A | 1.0860 | USD 0 | USD 5,430 |
| B | 1.0840 | USD 15 | USD 5,435 |
Offer A costs 5,000 × 1.0860 = USD 5,430. Offer B has a narrower exchange rate, yet 5,000 × 1.0840 + 15 = USD 5,435. Offer A is USD 5 cheaper. Calling EUR/USD a major neither reveals those two prices nor changes the arithmetic — and the same principle holds for crosses and exotics like EUR/PLN. To compare another quote later, obtain fresh executable prices for the exact same amount and delivery terms.
Market-wide turnover and typical spreads describe broad market conditions; they do not substitute for the offer available to this business. Even the largest major market can become costly or thin during a stress episode; the RBA’s account of March 2020 FX conditions documents deterioration across major currencies.
A cross does not force the client to trade through dollars
If the business instead needs to pay a British supplier using EUR (or settle a EUR invoice from PLN), it can accept a direct quote on EUR/GBP or EUR/PLN. The label “cross” does not require the client to split execution into a EUR/USD trade plus a USD/GBP (or USD/PLN) trade. CME’s cross-rate lesson likewise describes contracts quoted directly between two non-dollar currencies.
A liquidity provider may hedge or price a cross internally through other pairs, which is separate from the client-facing quote. Should a client manually construct a two-leg exchange, both executable sides, both sets of fees and settlement timing must be compared. A rate calculated from two midpoints is not an executable alternative.
Before comparing risk across symbols, name the underlying exposure first. Replacing EUR/GBP or EUR/PLN with EUR/USD solely to capture a tighter advertised spread creates a different currency risk and does not automatically hedge a non-USD invoice.
Market terminology and regulatory definitions have different boundaries
The folder label “Major” on a trading platform is not a universal legal margin schedule. Under the standard retail CFD rules across the EU (national ESMA-derived interventions, such as Poland’s KNF Decision DAS.456.2.2019), the UK FCA (COBS 22.5) and Australia’s ASIC, the “major currency pair” tier covers any two of USD, EUR, JPY, GBP, CAD and CHF. Under that rule, EUR/GBP qualifies for the lower 3.33% (~30:1) margin tier even though traders call it a cross, whereas AUD/USD — a traditional market major — falls into the 5% (20:1) tier because AUD is not on that six-currency list.
Margin lists also vary across major jurisdictions: US CFTC/NFA rules permit 50:1 (2%) on ten major currencies including AUD and NZD, whereas Japan’s JFSA caps retail FX at 25:1 (4%) across all pairs, and some national rules (such as Poland’s KNF experienced retail client tier) create conditional exceptions. Always check the legal rule, product specification and client category rather than inferring margin from a platform folder.
The practical sequence is therefore: identify your required currency exposure, verify the exact product and jurisdiction rules, compare executable prices and fees, and treat market category labels solely as background context.
Put the explanation to work
Three exercises with worked answers
Every rate and offer in these exercises is hypothetical. Choose an answer before opening the worked explanation. The third exercise is optional.
Explore the details
The complete classification: data, market structure and exceptions
The introductory example separates names from the transaction itself. Continue for the seven conventional majors, cross-rate markets, exotic-pair risks, CNY/CNH, the full Polish margin context and the difference between total and spot turnover in BIS data.
1. Why classify currency pairs?
The EUR 5,000 example compared two executable offers. Market classification adds a wider view: which participants, products and data sit behind a symbol? A provider’s CFD is a specific contract; the global spot market for the same pair is a different scope. The spread, available order size and product type must therefore be checked in the offering, rather than inferred from the folder name.
Large dollar markets usually have many sources of quotes, and participants use spot, forwards, swaps and options. A smaller market may offer less competitive prices for a particular amount or time of day. This is useful background, but not a price list: the same pair can have different costs on two CFD accounts. The number of pips is also insufficient for comparing different pairs, because a pip has different units and monetary values. In this lesson, we will clarify the categories and the coverage of the data; calculating the cost of an entire trade is covered in lesson 2.8.
There is no single list of majors, minors and exotics that is binding across the entire market. These are conventional terms; a broker or operator may define its own scope for its offering. A supervisory authority, however, may establish a specific definition in rules governing a product. The question “is this a major?” therefore requires context: a conventional list of pairs, turnover statistics, an organisational segment or a CFD margin rule?

2. Majors — seven pairs and nearly 60% of the market
2.1. The list and BIS 2025 data
In the common retail classification, majors comprise seven pairs involving the US dollar and one of EUR, JPY, GBP, CHF, AUD, CAD or NZD. This is the list we use in this article. The data below come from the final BIS annex published in June 2026, tables 3.9–3.11. They represent average daily turnover in April 2025 for spot, forwards, FX swaps, currency swaps and OTC options combined. The net-net basis removes local and cross-border double-counting of trades between reporting dealers. The denominator is USD 9,510,240 million per day; the data should not be read as retail CFD turnover.
| Pair | Nickname | Share (BIS 2025, final) | ~daily turnover |
|---|---|---|---|
| EUR/USD | Fiber* | 20.7% | ~USD 1.97 trillion |
| USD/JPY | USD/JPY | 14.4% | ~USD 1.37 trillion |
| GBP/USD | Cable | 7.5% | ~USD 0.72 trillion |
| USD/CAD | Loonie | 5.2% | ~USD 0.49 trillion |
| AUD/USD | Aussie | 4.9% | ~USD 0.47 trillion |
| USD/CHF | Swissie | 4.8% | ~USD 0.46 trillion |
| NZD/USD | Kiwi | 1.2% | ~USD 0.12 trillion |
The seven pairs total USD 5,588,506 million per day, or about 58.8% of global OTC FX turnover. EUR/USD alone accounts for 20.7%. The shares in the table are rounded to 0.1 percentage points; adding the displayed percentages can therefore produce a slightly different result from dividing the sum of the unrounded amounts by the total. The nicknames are informal and do not constitute a second official classification. For pair-by-pair breakdowns, see the interactive currency pair profiles toolkit.
The classic list retains historical market conventions, so it is not an automatically updated ranking of the seven highest-turnover pairs. The dollar plays an important role as a vehicle currency, but the statistic “USD on one side of the transaction” does not mean that every exchange of two other currencies must be executed through USD. The relationship between a pair and its two currencies is explained in the previous lesson.
2.2. What sets them apart?
High turnover and extensive infrastructure. EUR/USD and USD/JPY are among the largest currency markets. This usually supports competition among pricing sources and facilitates execution. Liquidity, however, has several dimensions: spread width, available size, the price impact of an order and the speed at which quotes are replenished. Turnover over an entire month does not measure all of these features at the moment of a particular order.
Terms depend on the offering and the time. A large market may provide competitive bid/ask quotes, but the major label does not guarantee a particular spread. The price for a small amount may differ from the price for a large notional, and a narrower spread may be accompanied by a separate commission. Rather than universal ranges such as “0.1–0.5 pips on a major”, you need to specify the provider, date, hours and measurement method. Without these details, the figures are not comparable market statistics.
Volatility is a separate measurement. It does not automatically follow from a pair being a major. To compare it, you need to use the same period and measure, such as daily returns or the price range as a percentage of the exchange rate. Volatility, spread and depth are related, but they are not synonyms. Arbitrage helps bring inconsistent prices into line; it does not eliminate repricing caused by new information or changes in interest-rate expectations.
Different products on the same pair. Major currencies have extensive spot and derivatives markets. This does not mean that every provider makes every variant available to every client. A CFD, a forward contract, an option and a futures contract have different terms and access channels. A ranking of all these transactions combined is not a ranking of retail product availability.
The term “commodity currencies” is an additional description, rather than a separate, mutually exclusive category. AUD, NZD and CAD are sometimes described this way because of the importance of commodities and exports to their economies. This does not establish a fixed rule that “ore prices rise, so AUD/USD rises”. Interest rates, the USD exchange rate, financial flows and expectations can act simultaneously. March 2020 is a useful counterexample: the Reserve Bank of Australia (RBA) linked large moves in AUD to global volatility and risk aversion, alongside relatively smaller changes in interest-rate differentials and prices of key export commodities. In a separate account of the FX market, it documented wider spreads and lower depth in AUD as well. This was a major pair experiencing deteriorating liquidity, rather than evidence of a single cause of the move or of slippage on every stop order.
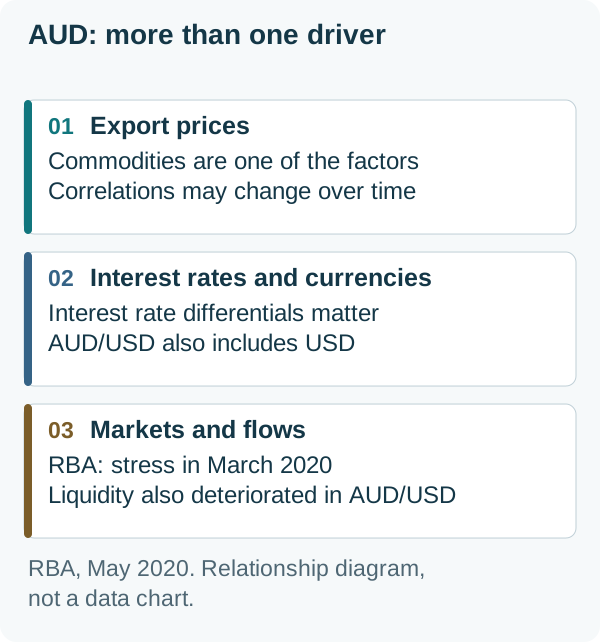
A major can also experience poorer execution. During a data release, a central bank decision or a sudden change in quotes, the price and available size can change rapidly. EUR/USD's status alone does not then guarantee execution at the price displayed a moment earlier. The RBA described this deterioration in the functioning of major markets in March 2020; the BIS report on the 2016 sterling event illustrates another case in section 8. The mechanics of accepting and executing instructions are discussed in the lesson on orders.
Commodity, regional and defensive currencies
Additional labels do not replace a pair's composition. “Commodity” points to the importance of exports and commodity prices, “regional” organises the market geographically, and “defensive” refers to historical responses to particular stress events. AUD/USD can be both a major and a pair involving a commodity currency. EUR/CHF consists of two G10 currencies, and the conventional description of CHF as defensive does not guarantee a stable exchange rate or low volatility.
RBA Deputy Governor Andrew Hauser provided a useful counterexample to the simple rule “risk-off = a stronger USD” on 7 March 2026. He compared periods of stress in which the dollar acted as a hedge with episodes that produced a different response, including the tariff announcement in April 2025. Safe-haven status depends on the type of shock and the investor's perspective. The label alone does not determine the direction of every exchange rate; in a pair, we always compare two currencies. This is a historical description, rather than a recommendation to protect a portfolio with a particular position.
2.3. USD/CNY overtakes GBP/USD
The final BIS 2025 data show the difference between rankings of pairs and currencies: USD/CNY (8.2%) overtook GBP/USD (7.5%) in its share of turnover. Note the two different measures: as a currency — counting all pairs together — the renminbi (8.6%) still trails sterling (10.2%). USD/CNY is not on the classic list of seven majors used here, yet it has the third-highest turnover among dollar pairs. The CNY code and a pair's traditional category describe different things from its position in the ranking.
The same distinction applies to sterling. GBP/USD's share fell from about 9.5% in 2022 to 7.5% in 2025, while GBP's share across all pairs fell from about 12.9% to 10.2%. The shares declined within a growing overall market, which is not equivalent to the same percentage decline in the nominal amount of turnover. Nor do these data automatically imply a change in GBP/USD's category. Share, amount and label describe different things.
In the turnover ranking for all OTC instruments, the four largest pairs are EUR/USD, USD/JPY, USD/CNY and GBP/USD. USD/CNY is not on the traditional list of seven majors used here, despite having higher turnover than GBP/USD. This illustrates a divergence between a conventional list and a ranking, without requiring either to be declared incorrect. Below, we will also clarify what the BIS includes under the CNY code.
Between 2022 and 2025, USD/JPY's share increased from about 13.5% to 14.4%, and USD/CHF's from 3.9% to 4.8%. However, transaction currency and reporting location are separate dimensions of BIS data. Turnover in Japan is reported on a net-gross basis, while global turnover by pair is reported on a net-net basis. You cannot subtract the first figure from the second to calculate “how much yen trading London has taken over”. Studying geography requires tables by jurisdiction and the same method of eliminating double-counting.
3. Crosses and minors — pairs without the dollar, terms with different scopes
3.1. Where does the name “cross” come from?
In conventional FX market usage, a cross is a pair without USD, such as EUR/JPY or EUR/GBP. Its price can be linked to two dollar pairs, but this does not mean that every actual transaction must pass through the dollar. Direct markets for crosses exist, including exchange-traded futures described by CME. In a calculation, however, a “cross rate” is a rate derived through a third currency; it can also involve a relationship with USD. The construction of prices is covered in more detail in lesson 2.3.
In the usage adopted here, the absence of USD is sufficient to call a pair a cross. Minor has a less clear-cut scope: it often means a cross of major currencies, but providers may use it for a different part of their offering. EUR/PLN is a cross because of its composition and can also be an exotic because of PLN's conventional category. There is no need to choose just one of these labels. Pairs without the dollar can include both the large EUR/GBP market and a much smaller market for two regional currencies.

3.2. The most popular crosses
| Pair | Currencies | Characteristics |
|---|---|---|
| EUR/GBP | euro / sterling | the euro against sterling; both currencies belong to G10 |
| EUR/JPY | euro / yen | the relationship between EUR and JPY; sometimes used in the carry trade |
| GBP/JPY | sterling / yen | the relationship between monetary policy and the GBP and JPY exchange rates; volatility needs to be measured |
| EUR/CHF | euro / franc | historical Swiss National Bank (SNB) minimum exchange rate, discontinued on 15 January 2015 |
| AUD/NZD | AUD / NZD | two currencies from the region; shared drivers do not guarantee a narrow trading range |
| EUR/AUD | euro / AUD | the euro against the Australian dollar; several simultaneous pricing drivers |
| CAD/JPY | CAD / yen | the Canadian dollar against the yen; the commodity currency label applies to CAD |
Since the dollar is on one side of about 89% of all transactions (final BIS 2025 data), transactions without the dollar — crosses — together account for about 11% of global turnover, slightly more than a trillion dollars per day. The largest individual crosses are EUR/GBP (~USD 169 billion per day), EUR/JPY (~99 billion) and EUR/CHF (~98 billion).
You can scroll the diagram horizontally or open it at full size.
3.3. When does a cross make sense?
A cross lets you express the relationship between two currencies without opening a separate position involving USD. EUR/GBP represents the euro's relationship to sterling. The economic exposure can also be constructed using appropriately chosen directions and notionals in EUR/USD and GBP/USD; mismatched amounts leave dollar exposure. Executing two trades differs from executing one: the prices, costs and risk arising from the time gap between execution of the two instructions are different. The word “cross” alone does not determine which approach will be cheaper for a given amount.
A cross can also be used to hedge a company's cash flows. In a hypothetical example, a company with USD (or PLN) as its reporting currency will receive GBP 900,000 and pay EUR 1,000,000 on the same date. At an assumed EUR/GBP rate of 0.8500, it needs GBP 850,000 to buy the euros; GBP 50,000 remains after the exchange. EUR/GBP describes the relationship between the two currencies being hedged, while the remaining GBP may still change in value against the company's reporting currency. The exposure is determined by the invoice currencies, amounts and dates, rather than simply by whether the counterparties are located in the United Kingdom or Finland. This is a model without costs or contract details, rather than a description of an actual company.
GBP/JPY illustrates another trap: a larger number of pips than on EUR/USD does not prove higher percentage volatility. The level of the exchange rate and the size of a pip differ. Comparing the two pairs requires consistent data from the same period and a single percentage measure. Informal names such as “Beast” or “Dragon” are no substitute for calculation; nor do they determine the order limit or the cost in a particular offering.
The UK referendum, 23–24 June 2016. The event shows that political risk also affects G10 currencies. In its August 2016 report, the Bank of England described sterling's sharp depreciation after the referendum. However, a rise or fall in GBP/JPY results from the relationship between the two currencies, so data for GBP/USD alone do not measure the cross's movement. Assessing an account would require specific execution prices, notional amount, costs and available capital; without them, it is impossible to calculate the loss or conclude that every account was wiped out.
The SNB maintained a minimum EUR/CHF exchange rate of 1.20 from 6 September 2011 until 15 January 2015 — for 1,227 days. After the floor was removed, execution conditions deteriorated sharply. The Bank of England's Financial Stability Paper No. 41 describes EUR/CHF falling to about 0.85 at 9:49 London time, or 10:49 in Switzerland, in the spot market studied. A fall from 1.20 to 0.85 is about 29.2%; the inverse relationship shows CHF appreciating against EUR by about 41.2%. These are two different denominators, rather than two contradictory assessments of the move. Trades continued to take place, but prices and available sizes were widely dispersed — saying that “liquidity ceased to exist” would be too literal. An ordinary stop loss does not guarantee a price; execution at another available price is possible. The UK Financial Conduct Authority (FCA) confirms that Alpari UK entered the formal Special Administration Regime on 19 January 2015. The lesson concerns execution risk in G10 currencies as well, rather than a fixed characteristic of all crosses.
4. Exotic pairs — a label with no uniform scope
4.1. What makes a currency exotic
The label “exotic” is not a measure of a country’s wealth. SGD may appear outside the majors category in a provider’s offering, even though Singapore is a developed financial centre. JPY is one of the traditional major currencies, regardless of the current assessment of Japan’s economy. “Exotic” is a loosely defined name for pairs outside the core group of currencies and products supported by a provider. It is not an official threshold for turnover, volatility or national income. USD/CNY, one of the world’s largest currency pairs, illustrates the limitations of this label particularly well.
Typical examples in educational and retail classifications include USD/TRY, EUR/PLN, USD/ZAR and USD/MXN: a major currency paired with a non-G10 currency. The term “double exotic” is also used for a pair of regional currencies, such as PLN/HUF. This name guarantees neither the availability of the symbol nor its trading conditions. The cross rate can be calculated through a third currency; access to a direct trade, the settlement method and the specific product must be checked separately.
4.2. The largest exotic pairs in BIS data
| Pair | Share (BIS 2025) | Distinctive market features or data coverage |
|---|---|---|
| USD/CNY | 8.2% | BIS includes offshore transactions referred to as CNH within CNY |
| USD/HKD | 3.6% | a USD-linked exchange rate system described by the Hong Kong Monetary Authority (HKMA) |
| USD/SGD | 2.3% | the Monetary Authority of Singapore (MAS) manages SGD against a basket, rather than the single USD/SGD pair |
| USD/INR | 1.9% | forwards include a substantial NDF segment; see the comparison below |
| USD/KRW | 1.7% | forwards include a substantial NDF segment; access rules are evolving |
| USD/MXN | 1.4% | total turnover exceeds USD/NOK, although MXN is outside G10 |
| USD/BRL | 0.9% | BIS data include both forwards and NDFs |
| USD/ZAR | 0.8% | a non-G10 currency; the label does not determine trading hours or the execution price |
| USD/TRY | 0.5% | a non-G10 currency; section 4.3 gives a historical example of a policy change |
| USD/PLN | 0.5% | higher total turnover than EUR/PLN, but lower spot turnover |
| EUR/PLN | 0.3% | higher spot turnover than USD/PLN; both a cross and a pair involving PLN |
Shares are calculated by dividing each pair’s turnover by USD 9,510,240 million per day and rounding to 0.1 percentage point. Source: the final BIS annex published in June 2026, tables 3.9–3.12 and 4.8, April 2025, all OTC FX instruments combined, on a net-net basis. The revision also changed the turnover amounts for individual pairs, so differences from the initial release are not solely due to rounding the global denominator.
Turnover figures alone do not determine the customary classification. USD/CNY accounts for 8.2% of global turnover, more than USD/CHF or AUD/USD, yet it is not on the list of seven majors adopted here. USD/HKD has higher turnover than many G10 crosses. These markets also operate under different rules: the HKMA describes HKD’s USD-linked exchange rate system, whereas MAS conducts policy against a currency basket. The SGD band against the basket is not a fixed USD/SGD band. The single word “exotic” overlooks these important differences.
4.3. Risks that can be particularly acute in exotic pairs
Liquidity risk. A price displayed for a small amount may not be available for the entire order. If quotes are withdrawn or the available size changes, the spread and execution cost may rise. This also happens in majors, but on a smaller market, fewer alternative sources of prices may make execution more difficult. A change in the mid-rate, a change in bid/ask prices and the absence of a price for the requested size must be distinguished. The direction of the subsequent move does not eliminate the problem of executing an earlier order.
Policy risk and sudden changes in rules. These are not confined to emerging markets: the UK referendum and the SNB decision involved G10 currencies. The Turkish example requires a date. It would be inaccurate to claim that the central bank refused to raise rates throughout 2018: on 13 September 2018, Turkey’s central bank (TCMB) raised its one-week repo rate from 17.75% to 24%. The announcement cited, among other factors, the exchange rate’s impact on prices. The decision confirms a policy change, but does not itself establish exactly what caused the earlier move in the lira or the loss incurred by a particular client.
Time-of-day and calendar risk. Participant activity and available amounts vary between sessions and on holidays. CFD availability for most of the day does not mean that every underlying market has the same depth throughout that period. For PLN, it is worth comparing actual conditions during and outside European trading hours, rather than assuming a fixed “8:00–17:00 CET” window. CET denotes winter time, while server times may use yet another offset. Even EUR/USD offers no guarantee of a constant spread throughout the day.
Access and convertibility. Restrictions on currency transfers, a lack of quotes and a prohibition on a particular transaction are different problems. Rules governing residents, authorised dealers and documentation can change. One example is the guidelines issued by the Central Bank of Nigeria (CBN) on 29 November 2024 for Nigeria’s FX market, which replaced arrangements introduced in June 2023. This does not justify treating all NGN transactions as non-convertible or as available only through NDFs. A product’s settlement method does not replace checking the applicable access rules.

NDF — non-deliverable forward — is a forward contract settled by paying the difference between the agreed exchange rate and a reference rate in an agreed settlement currency, often USD. The two full notional amounts are not delivered. This is a product definition, not a synonym for an exotic currency or an assurance that all transactions in that currency are non-deliverable. NDF pricing and available trade sizes are subject to their own terms; there is no universal rule that an NDF is always more expensive than every onshore contract.
CNY and CNH in statistics and in a specific offering
CNY is the ISO code for the renminbi. CNH is the market designation for the offshore segment of the same currency, not a second code for a separate national currency. The HKMA describes onshore and offshore segmentation and the differences between their prices. A distinction based on the location and rules of trading is not a distinction between contract types: different products may be traded within these segments. CNY, CNH and NDF should not be presented as three distinct currencies.
The BIS guidelines for the 2025 survey, table 5, explicitly state that the CNY category includes offshore transactions referred to as CNH. Thus, the USD/CNY share of 8.2% is a statistical aggregate, not a measure of a single onshore product or of the retail symbol USD/CNH. To compare offerings, you need to know the symbol, product type and delivery or settlement rules.
| Pair in BIS data | Total outright forwards | Of which: NDFs | NDFs / forwards |
|---|---|---|---|
| USD/INR | 90,003 | 70,570 | 78.4% |
| USD/KRW | 85,957 | 68,122 | 79.3% |
| USD/CNY | 80,589 | 11,892 | 14.8% |
NDFs are part of outright forwards, so the two columns must not be added together. For USD/INR, the share is 70,570 ÷ 90,003 × 100% = 78.4%. In these data, USD/CNY has substantial forward turnover, but a much smaller NDF share than USD/INR or USD/KRW. Rankings of all instruments, forwards and NDFs answer three different questions. The amounts come from the final BIS annex, tables 3.1 and 3.2; they are neither hypothetical figures nor available order-size limits.
Interest alone does not determine the return in currency terms. In a hypothetical model with returns measured in your account currency (such as USD or EUR) and no costs or leverage, an asset denominated in a high-yield foreign currency earns 6% in a year, but a unit of that currency loses 10% against your account currency. Its final value in the account currency is 1.06 × 0.90 = 0.954 times its initial value, giving a return of −4.6%. Subtracting 10% from 6% is not enough, because the account-currency value of the interest earned also falls. This is a simplified deposit model, not a CFD swap calculation or a forecast for any individual country; it illustrates why positive yield never guarantees a positive translated return.
4.4. Retail CFD regulation across jurisdictions (EU, UK, US, Australia and Japan)
Regulatory leverage limits do not mirror traders’ informal labels. Across the European Union (permanent national product intervention measures replacing ESMA’s temporary intervention, e.g. BaFin, AMF, CySEC and Poland’s KNF Decision DAS.456.2.2019, point 3), the United Kingdom (FCA COBS 22.5) and Australia (ASIC Product Intervention Order 2020/986, extended by 2022/259), a “major currency pair” is strictly defined as any two currencies from USD, EUR, JPY, GBP, CAD and CHF (3.33% minimum initial margin / ~30:1 leverage for standard retail clients; 5% / 20:1 for all other currency pairs).
Other major jurisdictions apply different lists and caps. In the United States (CFTC 17 CFR § 5.9 and NFA Compliance Rule 2-36), retail off-exchange FX allows a 2% minimum security deposit (50:1) on ten designated “major currencies” — USD against EUR, GBP, CHF, JPY, CAD, AUD, NZD, SEK, NOK and DKK (plus crosses within that list) — and 5% (20:1) on non-majors. In Japan (JFSA rules), retail FX leverage is capped uniformly at 25:1 (4% minimum margin) across pairs. Within Poland specifically, point 4(a) and (b)(ii) of KNF Decision DAS.456.2.2019 also allow an eligible “experienced retail client” (requiring registered office or habitual residence in Poland when concluding the agreement) to access 1% minimum initial margin (100:1) on other pairs too; providers may always impose stricter margin requirements.
| Regulator / Jurisdiction | Qualifying “Major” pairs | Major cap / margin | Other FX pairs / notes |
|---|---|---|---|
| EU (ESMA-derived national rules), UK FCA COBS 22.5, Australia ASIC | Any two of USD, EUR, JPY, GBP, CAD, CHF (e.g. EUR/GBP, EUR/USD) | 30:1 (3.33%) | 20:1 (5%), including AUD/USD & NZD/USD; Polish KNF allows 100:1 (1%) for eligible experienced retail clients |
| US CFTC (§ 5.9) / NFA (Rule 2-36) | EUR, GBP, CHF, JPY, CAD, AUD, NZD, SEK, NOK, DKK (+ USD) | 50:1 (2%) | 20:1 (5%) on non-major currencies (retail spot FX; OTC CFDs not permitted for US retail) |
| Japan JFSA | Uniform cap across regulated retail FX pairs | 25:1 (4%) | 25:1 (4%) uniform retail FX cap |
Always confirm the legal entity’s regulator and your client classification; brokers may set higher margin requirements than the statutory minimum. Check exact collateral requirements with the margin calculator.
| Pair | Label used in this lesson | G10 / non-G10 composition | Statutory minimum margin / approx. leverage limit |
|---|---|---|---|
| EUR/USD | major | G10 + G10 | 3.33% / approximately 30:1 |
| AUD/USD | major | G10 + G10 | 5% / 20:1 |
| EUR/GBP | cross; usually a minor | G10 + G10 | 3.33% / approximately 30:1 |
| USD/NOK | outside the list of seven majors | G10 + G10 | 5% / 20:1 |
| EUR/PLN | cross; usually exotic | G10 + non-G10 | 5% / 20:1 |
| USD/CNY | outside the list of seven majors | G10 + non-G10 | 5% / 20:1 |
“Approximately 30:1” rounds the reciprocal of 3.33%. The table shows the standard retail regulatory floor in the EU, UK and Australia, not a broker’s internal tiered margin schedule or permission to risk the entire account balance on one position.
Under the EU/UK/Australian framework, therefore, EUR/GBP may sit in a platform’s “Minors” folder while sharing the 3.33% margin floor with EUR/USD, whereas AUD/USD sits under “Majors” yet requires at least 5%. Margin calculations for a given notional, free funds and close-out mechanics are covered in the lesson on leverage and margin (and Poland’s experienced-client rules in lesson 2.6).
4.5. Rollover and overnight spread widening
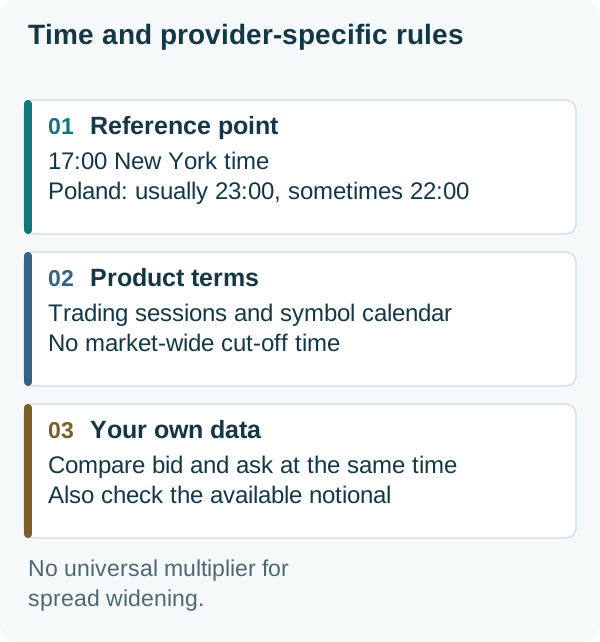
Market activity may decline around the end of the trading day and during transitions between sessions. In FX, an important reference time is 17:00 New York local time (22:00 GMT / 23:00 CET, shifting by an hour during brief periods when US and European daylight-saving changeover dates differ). This does not mean that every broker closes trading, charges financing and widens spreads to the same extent at that time. Sessions, the settlement time and swap parameters are part of the product specification. The label “exotic” alone does not specify when prices will change or by what multiple.
A practical comparison requires bid and ask records from several days at the same time, including holidays, rather than a single screenshot. It is worth distinguishing a worse price for a small amount from a reduction in the available notional. If the trigger condition for a standard stop is checked against the bid or ask, spread widening can trigger it even without a large move in the mid-rate. The relevant side of the price and the execution method are determined by the order rules. Lesson 2.7 explains them.
The cut-off, meaning the deadline for processing or settlement, should not be equated with a uniform “closing of the books at all institutions”. Individual products and currencies have different calendars. MetaTrader’s symbol-parameter documentation shows, among other things, separate sessions, swap values and the day on which a multi-day swap accrual is applied. The presence of these fields does not provide a market average, but it shows which conditions are specific to the symbol and provider.
4.6. Hidden costs: swap and carry in exotic pairs
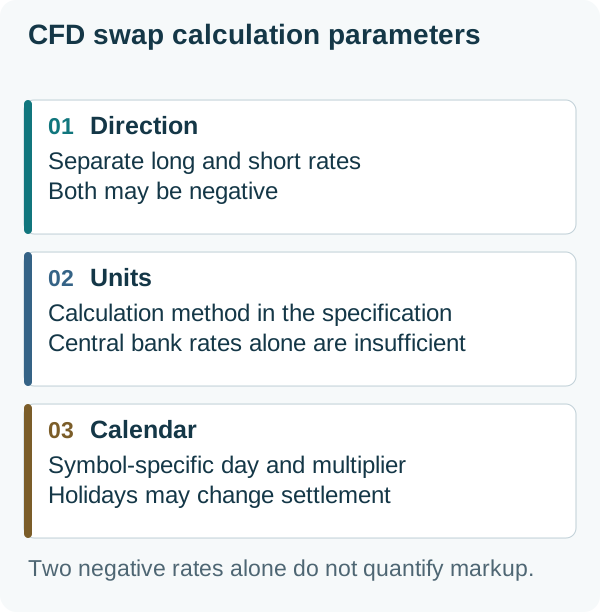
Interest rate differentials may attract interest in carry trades, but they do not automatically determine the accrual on a CFD account. Swap accruals on long and short positions depend on the financing method, contract parameters and provider fees. Negative values in both directions do not, by themselves, establish the size of a particular markup. The sign, calculation unit and rate must be read from the specification; a calculator cannot replace these inputs.
An exchange rate move and a gap between available prices can outweigh positive interest accruals. Interest accruals are one component of the return and must be considered alongside the change in the asset’s value. The model in section 4.3 showed the exchange rate’s effect on the account-currency value of interest. In CFDs, the applicable notional, costs and leverage also come into play. The full financing calculation and the distinction between swap and forward points are discussed in the lesson on costs and can be tested in the swap calculator; the important point here is that “exotic” does not imply a positive swap.
Under the standard T+2 spot convention, rolling a position on Wednesday to the next business day moves the value date from Friday to Monday, provided there are no holidays. This explains the multi-day accrual commonly applied on Wednesdays. Holidays, a different settlement cycle and CFD rules can change the day or multiplier — the symbol parameter takes precedence over the simplification. A second step concerns conversion into the account currency. For example, with an account denominated in EUR, GBP or PLN, the profit or loss on a product based on USD/MXN may need to be converted from the profit currency into your account currency. The pair’s name determines neither the account currency nor the currency conversion cost; the product’s separate currencies must be checked.
5. Case study: the Polish zloty (PLN) — FX versus equity-market classifications
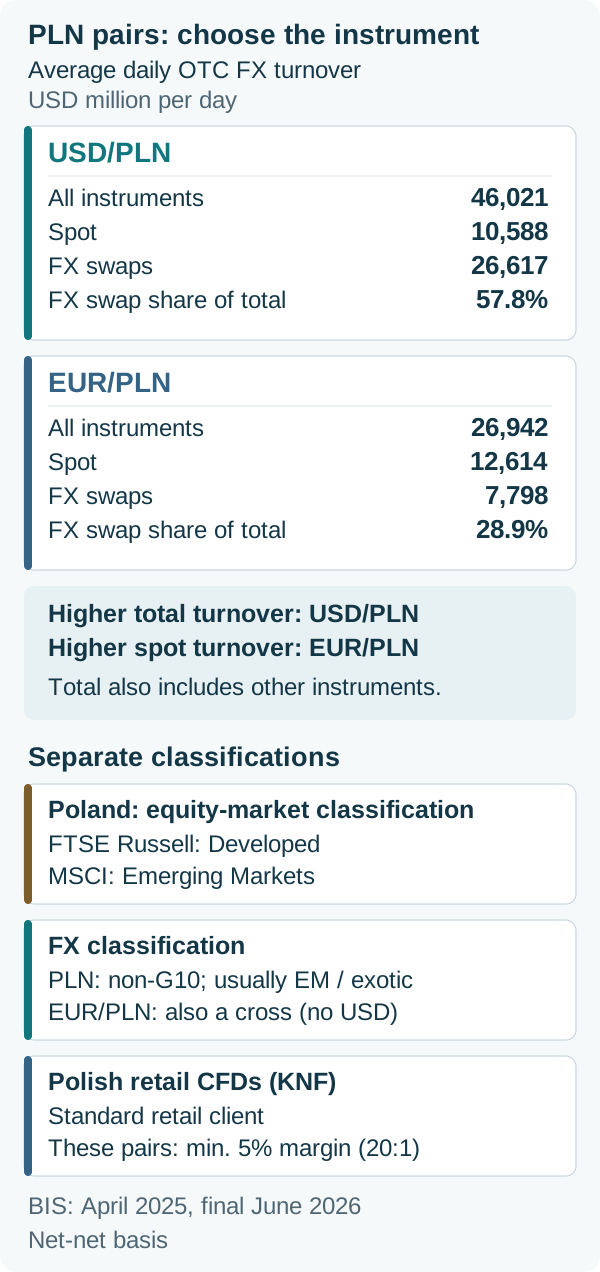
PLN does not belong to the conventional G10 group. In market descriptions, zloty pairs are usually classified as EM FX or exotic pairs. This does not imply a single official classification covering all products. EUR/PLN is also a cross because it does not include USD, while EUR belongs to G10. Each of these statements describes a different aspect, and they do not contradict one another.
Equity market classification answers a different question. FTSE Russell moved Poland to Developed status effective 24 September 2018. In the MSCI Poland IMI classification, however, Poland is assigned to Emerging Markets. Index providers apply their own criteria for market accessibility and functioning. There is no reason to transfer their labels directly to a currency or a CFD margin requirement.
The equity market, the international PLN market and retail CFD offerings do not represent the same set of transactions. Index criteria do not change the currencies in EUR/PLN, and the size of global FX does not determine a foreign investor’s access to Polish equities. Nor is there an established threshold at which “the zloty stops being exotic once it catches up with CHF”. If an operator uses such a category, its meaning must be taken from that operator’s definition rather than inferred from a single turnover figure.
The practical relevance of PLN depends on a company’s cash flows, its account and execution conditions. EUR/PLN expresses the value of the euro in zlotys; USD/PLN expresses the value of the dollar. Choosing the appropriate currency relationship does not require deciding whether an exotic pair is “good”. BIS data also show that the description “the larger zloty pair” requires specifying the instrument. USD/PLN leads in the overall ranking, but EUR/PLN leads in spot alone.
USD/PLN or EUR/PLN — the answer changes with the instrument
| Pair | All instruments | Spot | FX swaps | FX swaps as a share of the pair’s total |
|---|---|---|---|---|
| USD/PLN | 46,021 | 10,588 | 26,617 | 57.8% |
| EUR/PLN | 26,942 | 12,614 | 7,798 | 28.9% |
Total USD/PLN turnover is about 1.71 times that of EUR/PLN: 46,021 ÷ 26,942. In spot, the relationship reverses: 12,614 ÷ 10,588 = 1.19, so EUR/PLN turnover is approximately 19.1% higher than USD/PLN turnover. Much of the difference in the overall figures comes from FX swaps, which involve exchanging currencies on two dates. These are not the same as the overnight charge called a “swap” on a CFD account. Other instruments are included in the total, so the sum of spot and FX swaps need not equal total turnover.
The amounts come from Tables 3.3, 3.7, 3.11 and 4.2, 4.5 and 4.8 of the final BIS annex, converted to USD for comparison. USD is the common statistical unit here: reporting EUR/PLN turnover in dollars does not add USD to the pair. The amounts do not measure the notional available in a particular second either. Higher EUR/PLN spot turnover does not automatically imply a lower spread for every EUR/PLN CFD. The conclusion is narrower and testable: changing the set of instruments changes which of these two pairs leads the ranking. When analysing your own product, first choose a matching data scope.
March 2020 — exchange rate movements versus execution costs. In the Table A archive of Narodowy Bank Polski (NBP), Poland’s central bank, the EUR/PLN reference (mid) rate was 4.3237 on 2 March and 4.6044 on 24 March 2020. The difference is PLN 0.2807 per EUR, approximately 28.07 groszy (100 groszy = PLN 1) and 6.49% of the starting rate. These are two reference rates published 22 days apart, not an intraday low and high. They cannot reconstruct retail bid/ask quotes, slippage or a particular client’s transaction costs. That would require data from the client’s provider, with timestamps and notionals. The sharp movement in the zloty and the deterioration in global liquidity in March 2020 are consistent facts, but NBP rates alone cannot establish that one currency category cost a particular multiple of another.
Two index providers can classify the same market differently without either provider getting the country’s name wrong. You need to state the provider, what is being classified and the effective date. A change in the number of countries in an index or in Poland’s portfolio weight does not automatically change PLN’s category. The same applies to a platform: placing EUR/PLN in “Crosses” or “Exotics” does not change the currencies in the pair or the minimum CFD margin requirement.
6. G10 versus EM — how banks organise the market
Alongside the division into majors, minors and exotic pairs, another classification is common among institutional participants: G10 currencies versus emerging-market (EM) currencies.
G10 FX is an established group of currencies: USD, EUR, JPY, GBP, CHF, AUD, CAD, NZD, SEK and NOK. It is a market convention, not a continually updated ranking of the ten highest-turnover currencies. This scope was explicitly defined, for example, in the FCA’s 2015 decision concerning Barclays. It is not the same as the list of countries in the historical Group of Ten. A high position for CNY, HKD or SGD in the BIS ranking does not make them part of G10 FX.
EM FX can be used to organise coverage of currencies outside G10. In the cited FCA document, EM meant precisely the other currencies traded by Barclays; this is a definition in a specific document, not an official status for all economies. Institutions may further divide their coverage into Asia, Latin America or CEEMEA — Central and Eastern Europe, the Middle East and Africa. Such names organise teams and risk. They do not guarantee a single pricing model, the availability of every product or which employee will receive every client enquiry.
The Norwegian krone provides a simple test of the distinction between a currency and a pair. NOK belongs to G10, but USD/NOK is not among the seven majors used in this lesson. In the final BIS data, USD/NOK turnover is USD 85,341 million per day, below the USD 133,919 million for USD/MXN, which includes a currency outside G10. These amounts refer to pairs, not to NOK or MXN across all their pairs. They do not imply that one country is less developed or that every USD/NOK order receives worse execution. Convention, market size and transaction conditions remain separate pieces of information.
7. How the currency landscape changes
Turnover and market access arrangements change even when the familiar list of majors stays the same. The historical series in Table 1 of the final BIS annex show changes in a currency’s share; the detailed pair tables reveal a different aspect. The two measures should not be mixed in a single ranking.
A larger renminbi share. CNY’s share of currency turnover was approximately 2.2% in 2013, 4.3% in 2019, 7.0% in 2022 and 8.6% in 2025. This is an almost fourfold increase in share over twelve years, not automatically a fourfold increase in the turnover amount itself. As a pair, USD/CNY accounted for 8.2% in 2025. Comparing KRW with NZD also requires two pairs: USD/KRW at USD 165,352 million per day exceeds NZD/USD at USD 118,687 million; USD/TWD at USD 113,620 million is close to the latter amount but does not exceed it.
A lower share does not establish declining turnover. In 2025, GBP’s share as a currency was 10.2%, while EUR’s was 28.5%. Comparing their amounts with the previous survey requires accounting for the larger global denominator. Calling a fall in share a “decline in importance” is already an interpretation; it does not determine liquidity at specific hours or the currency’s role in invoicing and hedging.
Trading location is another dimension. A transaction in a pair involving JPY or PLN may be executed and reported outside Japan or Poland. The BIS geographical tables describe the reporting dealer’s jurisdiction, not the currency’s nationality. A change in a currency’s share therefore cannot be attributed exclusively to one financial centre. Country comparisons must use the same geographical table and the net-gross basis, which is distinct from the global net-net basis used here for pairs.
USD/CNY compared with GBP/USD shows that rankings and the traditional list can diverge. There is no single authority required to “promote” a pair once it crosses a turnover threshold. The author of a table may define majors as popular USD pairs or adopt another list, but should specify its scope. For the reader, information about the instrument, access and execution conditions is more useful than a change in the label alone.
Restrictions in the KRW market should not be presented as permanent. In a statement dated 16 June 2024, South Korea’s finance ministry described extending KRW/USD market hours from July 2024 to 02:00 the following day instead of 15:30 (Korea Standard Time, UTC+9). This is a dated example of reform, not a promise of the current hours for every product in 2026. Global BIS data also cover both spot and forward contracts, including NDFs. Market development does not require an automatic change in USD/KRW’s customary label.
8. Liquidity is a spectrum, not three boxes
The division into majors, minors and exotic pairs is a convenient starting point. To assess execution, however, you need to move from the category level to the pair, product, notional and transaction time. Turnover is the sum of the notionals of completed transactions; liquidity also includes the availability of a price for a new order. The first is a historical aggregate; the second changes with the quotes on offer. They are not interchangeable.
Total turnover data span a wide range: approximately USD 1.97 trillion per day for EUR/USD, USD 1.37 trillion for USD/JPY, USD 467 billion for AUD/USD, USD 347 billion for USD/HKD, USD 169 billion for EUR/GBP, USD 49 billion for USD/TRY and USD 27 billion for EUR/PLN. These are final BIS data from a single month, covering various instruments. They are not a list of amounts that can be executed immediately. The same pair may offer competitive prices for a smaller amount and less favourable prices for a larger one; conditions may deteriorate during a market event without the category name changing.
The sharp GBP/USD move on 7 October 2016. The BIS report prepared with the Bank of England describes a trade on Reuters Matching at 1.1491 at 00:07:41 British Summer Time (BST, UTC+1), versus approximately 1.26 before the event. The fall in this exchange rate is about 8.8%: (1.1491 ÷ 1.26 − 1) × 100%. Lower prices were recorded on some platforms, so 1.1491 is not a single low for the entire decentralised market. The report identifies a combination of factors, including a time of lower activity, participants’ behaviour and automated execution. It does not establish that one type of algorithm caused the entire event. The major remained a major, although pricing conditions were exceptional for a short time.
The data do not support the rule that “G10 always has a deeper market”. In the BIS survey, EUR/NOK has USD 14,958 million in daily spot turnover, compared with USD 12,614 million for EUR/PLN. The difference is approximately 18.6%, but even a like-for-like spot measure does not determine the available notional or spread at a chosen hour. The first pair contains two G10 currencies, while the second contains only one; neither description is a standalone measure of execution. You need data appropriate to the transaction you are actually comparing.
A single price comparison instead of a ranking of labels
The raw ask − bid difference has a different unit and scale for each pair. To compare only the relative width of a quote, you can divide it by the mid-rate and multiply by 10,000. The result is in basis points (1 basis point = 0.01%), which are distinct from a currency pip. Below are three hypothetical two-way quotes for a specified small amount at the same moment; they are neither spread statistics nor a broker’s offer.
| Pair | Bid / ask | Mid-rate | (Ask − bid) / mid-rate × 10,000 |
|---|---|---|---|
| EUR/USD | 1.0999 / 1.1001 | 1.1000 | 1.82 basis points |
| EUR/PLN | 4.2990 / 4.3010 | 4.3000 | 4.65 basis points |
| USD/MXN | 19.9980 / 20.0020 | 20.0000 | 2.00 basis points |
In the model, USD/MXN has a larger numerical ask − bid difference than EUR/PLN, but a smaller relative difference. Both pairs can be called exotic, yet that label does not rank their costs even in such a simple comparison. The figures do not establish that this is what the actual market looks like. They show how to check a comparison: match the amount, moment, product, unit and executability of the prices. This measure does not cover the total cost of entry and exit, commissions, holding the position or currency conversion; the full cost calculation belongs in Lesson 2.8 and the trading costs calculator.
Volatility requires similar discipline. Hypothetical moves in EUR/USD from 1.1000 to 1.1110, USD/JPY from 150.00 to 151.50 and GBP/JPY from 190.00 to 191.90 each represent a 1% rise. The nominal exchange rate changes look different, but their relative size is the same. In an actual comparison, you also need to match the period and type of data. You must not infer a ranking of risk solely from the number of pips or a pair’s colloquial nickname.

9. What to remember before opening your platform
Before comparing offerings, establish what the label refers to: the currencies in the pair, a customary list, G10 currencies, BIS statistics or CFD regulations. Then check the product, hours and calendar, prices for your chosen amount, financing terms and how profit or loss is settled or converted into your account currency. High turnover provides useful context, but the quote available to you determines the price of your own transaction. The next lesson on bid/ask and cross rates will show you how to read that quote correctly.
FAQ — currency pair classification in practice
Does higher turnover automatically make a pair a major?
No. The traditional list of majors used here comprises seven USD pairs. USD/CNY has higher total turnover than GBP/USD, but is not on that list. There is no universal official threshold for promotion. Another provider may use a different scope, so you need to check how the table is defined.
Do cross and minor mean the same thing?
They are often used interchangeably for non-USD pairs composed of major currencies, but the scope of minor is less consistent. In this lesson, cross describes the absence of USD. In calculations, “cross rate” can refer more broadly to a rate derived through a third currency.
Can EUR/PLN be both a cross and an exotic pair?
Yes. Cross refers to the absence of USD in the pair, while exotic refers to the customary category of a pair containing a currency outside G10. EUR is a G10 currency; PLN is not. These facts do not contradict each other, and do not determine the spread by themselves.
Under EU ESMA, UK FCA and ASIC rules, why is the leverage limit 20:1 for AUD/USD but approximately 30:1 for EUR/GBP?
The market’s list of majors is not the regulatory list. Under EU ESMA-derived national interventions (such as Poland’s KNF Decision DAS.456.2.2019), UK FCA COBS 22.5 and Australia’s ASIC Product Intervention Order 2020/986, a minimum initial margin of 3.33% (~30:1) applies to any two currencies drawn from USD, EUR, JPY, GBP, CAD and CHF. EUR/GBP meets that condition, while AUD/USD does not and is therefore subject to a 5% minimum (20:1) — in contrast to US CFTC/NFA 50:1 major lists. These are standard retail regulatory floors; a broker may require more.
Does higher turnover mean a lower execution cost?
Not for every transaction. A monthly ranking may cover instruments other than the product being compared, and conditions depend on the amount, time and provider. USD/PLN has higher total turnover than EUR/PLN, but lower spot turnover. Neither relationship determines the spread of a particular CFD.
Do BIS data for USD/CNY measure only the onshore market?
No. The 2025 survey guidelines explicitly include offshore transactions described as CNH within the CNY category. CNH is not a separate ISO currency code. NDF, in turn, is a type of contract; it should not be equated with the entire CNY or CNH market.
Sources and further reading
- BIS: final annex to the Triennial Survey 2025, June 2026 — Table 1: global turnover and currencies; 3.9–3.12 and 4.8: total turnover by pair; 3.1–3.2: outright forwards and NDFs; PLN spot/FX swaps/total: 3.3, 3.7, 3.11 and 4.2, 4.5 and 4.8. April 2025, net-net; geographical data separately on a net-gross basis.
- BIS: 2025 survey guidelines — turnover — Definitions of spot, outright forwards, NDFs and FX swaps; Table 5 includes offshore CNH in the CNY category; rules for eliminating double-counting.
- ESMA: notice of the CFD intervention renewal decision, 23 January 2019 — Historical EU-wide basis for the major-pair distinction: Annex I, any two currencies from USD, EUR, JPY, GBP, CAD and CHF. ESMA’s statement of 24 February 2026 confirms permanent national measures replaced the temporary intervention.
- UK FCA: COBS 22.5 Restrictions on retail CFDs — Permanent UK rules: 3.33% (30:1) for six-currency pairs and 5% (20:1) for non-major FX pairs.
- Australia ASIC: Corporations (Product Intervention Order — Contracts for Difference) Instrument 2020/986 (extended by 2022/259) — Australian retail CFD leverage limits (30:1 major / 20:1 minor FX pairs).
- US CFTC: 17 CFR § 5.9 and NFA Compliance Rule 2-36 — 2% (50:1) security deposits for designated major currencies (including AUD, NZD, SEK, NOK, DKK) and 5% (20:1) for non-majors.
- Japan FSA (JFSA): Retail FX leverage regulation — Statutory 25:1 (4% minimum margin) cap across retail currency pairs in Japan.
- KNF: Decision DAS.456.2.2019 of 1 August 2019 — Polish national rules: point 3 (3.33% / 5%) and point 4(a), (b)(ii) (1% minimum for eligible experienced retail clients resident in Poland).
- FCA: Barclays Bank Plc — Final Notice, 20 May 2015 — The document’s glossary defines the ten G10 currencies and EM as the bank’s other currencies; a dated example of market organisation, not a uniform definition for all countries.
- CME: Trading Cross-Rate Futures — Direct cross-rate contracts; no basis for claiming that every exchange involving a cross must pass through USD.
- RBA: International Financial Conditions, May 2020 — An account of large AUD moves amid global volatility; commodities are not the sole automatic cause of price movements.
- RBA: Box B — Recent Developments in Foreign Exchange Markets, May 2020 — Deteriorating liquidity, wider spreads and reduced depth also affected major currency markets.
- SNB: discontinuation of the minimum exchange rate, 15 January 2015 — End of the minimum EUR/CHF exchange rate of 1.20; the announcement is not a complete record of all execution prices.
- Bank of England: Gauging market dynamics using trade repository data, FSP 41, January 2017 — In the spot market studied, EUR/CHF fell to approximately 0.85 at 9:49 London time on 15 January 2015; price dispersion and differences between spot and forward markets.
- FCA: information for Alpari UK customers — Formal Special Administration Regime from 19 January 2015.
- Bank of England: Inflation Report, August 2016 — Sterling depreciation after the referendum; not evidence of a specific GBP/JPY move or a loss on every account.
- BIS Markets Committee: The sterling flash event of 7 October 2016, January 2017 — Reuters Matching: 1.1491 at 00:07:41 BST; a multifactor event and different lows on different platforms.
- LSEG: WMR FX Benchmarks Methodology, v30, January 2026 — WMR Closing Spot at 16:00 UK time; Sections 1.2 and 4.4: benchmark uses and the five-minute calculation window.
- HKMA: The Linked Exchange Rate System of Hong Kong — The mechanism linking the HKD exchange rate to USD; not a classification of poor and rich countries.
- MAS: Singapore’s Monetary Policy Framework — Management of SGD’s nominal effective exchange rate against a basket, not a fixed band for USD/SGD alone.
- HKMA: offshore renminbi market, Quarterly Bulletin, March 2017 — CNY and CNH describe onshore and offshore renminbi; segmentation can create differences in prices.
- SIX: current list of ISO 4217 codes — CNY is the renminbi code; CNH is not a separate currency code on the ISO list.
- TCMB: interest rate decision, 13 September 2018 — Increase in the one-week repo rate from 17.75% to 24%; correction of the claim that rate rises were refused throughout the year.
- CBN: Revised Guidelines for the Nigeria Foreign Exchange Market, 29 November 2024 — Changes to market rules replacing the June 2023 reform; dealer requirements do not establish that the naira is wholly non-convertible.
- FTSE Russell: Poland country classification — FAQ — Poland’s equity market moved to Developed status effective 24 September 2018; the scope concerns index classification.
- MSCI: MSCI Poland IMI — The index’s assignment to Emerging Markets; a different provider and different criteria from FTSE.
- NBP API: EUR, Table A, March 2020 — Published Table A reference (mid) EUR/PLN rates: 4.3237 on 2 March and 4.6044 on 24 March; no information on intraday bid/ask quotes.
- South Korea’s finance ministry: FX market trading hours, 16 June 2024 — A dated reform extending the session from July 2024 to 02:00 the following day (Korea Standard Time, UTC+9); not a statement of the current schedule for all products.
- MetaQuotes: symbol properties — Separate parameters for the profit currency, long/short rates, calculation method, sessions and the day of multiple swap charges.
- RBA: On the Safe-haven Status of the US Dollar, 7 March 2026 — Safe-haven characteristics and counterexamples to USD responses to different shocks, including April 2025; no guarantee of a fixed exchange rate response.