
Forex myths and facts: what can be verified, and what is a promise?
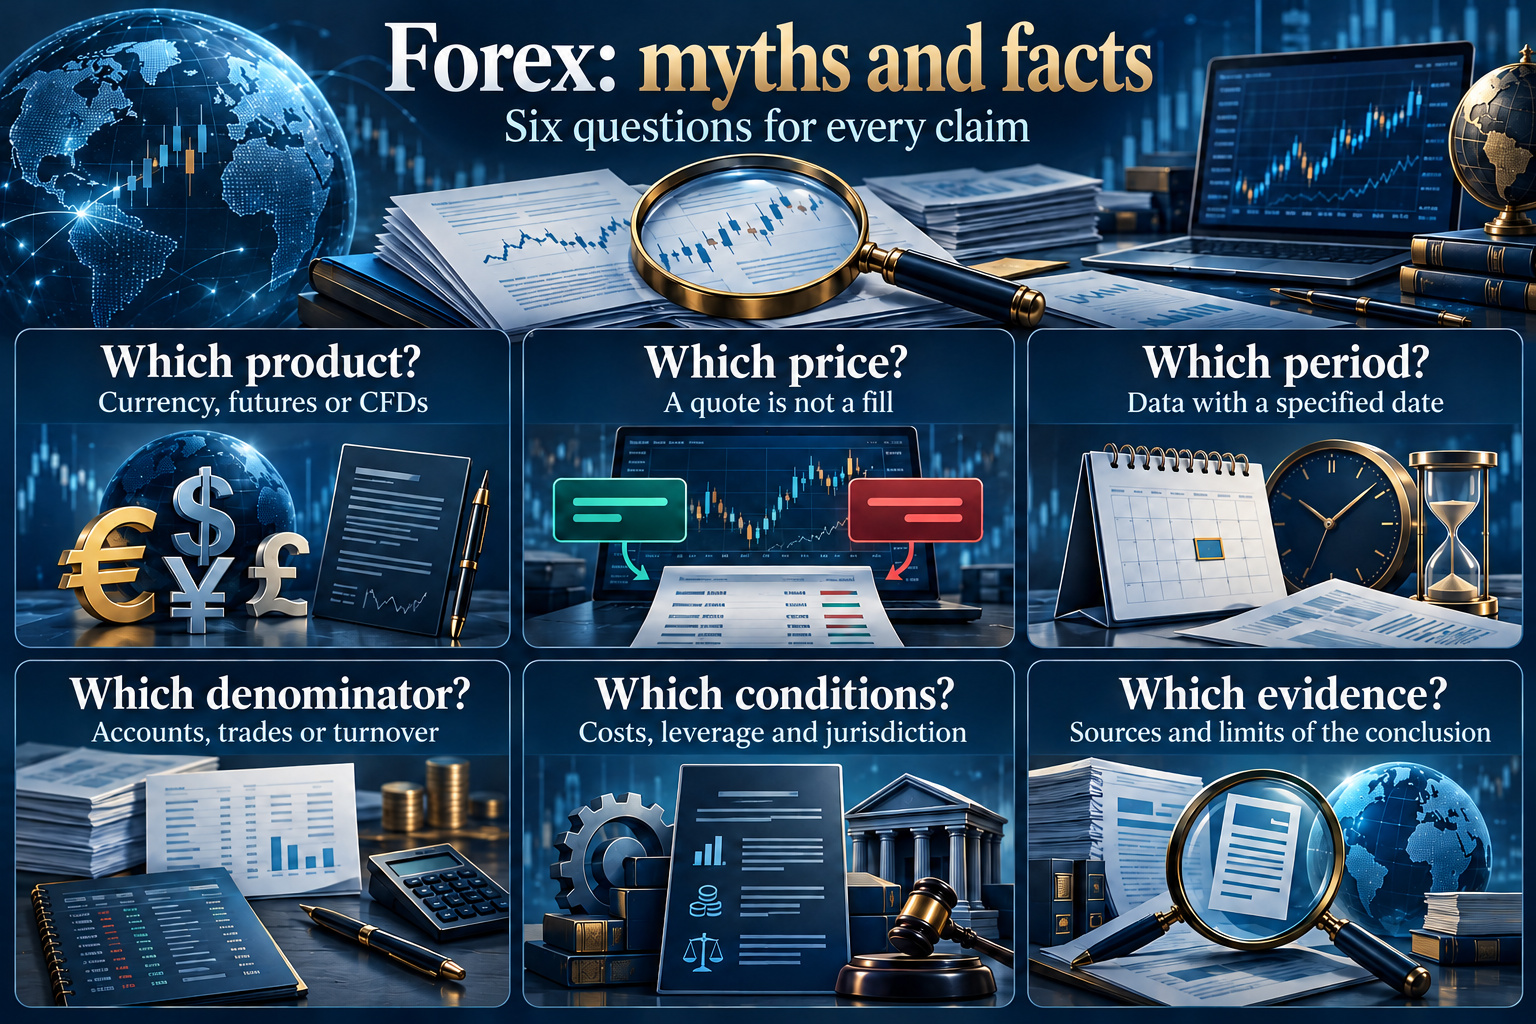
To assess a Forex claim, identify the product, the measure and the evidence. An 80% win rate, a licence number and a rising demo chart answer different questions. We will test a hypothetical automated-trading offer, calculate what its headline leaves out and then examine 23 common claims in detail, with their sources and limits.
An 80% win rate: would you buy this trading service?
Imagine an advertisement for an automated Forex strategy. It shows a rising demo-account chart, says that 80% of its trades were profitable and displays a financial firm's licence number. Below it, the seller adds that foreign exchange is the world's largest financial market. The implied conclusion is tempting: a sophisticated system, an established provider and plenty of opportunity.
This is a hypothetical teaching example, not an account of a particular company. Each item needs a different test. The percentage calls for arithmetic, the chart for a complete record and the licence number for an identity check. None can do the other two jobs.
For now, suppose the strategy trades a cash-settled currency CFD: a contract linked to an exchange rate. It does not buy euros for delivery to a bank account. That matters because the contract's costs, order rules and provider are part of the result being advertised.
Sixteen winning trades can still leave a loss
We obtain the complete record for the advertised period: 20 closed trades. Sixteen made $25 each before the additional costs below; four lost $150 each. Assume that each completed trade, winning or losing, also incurs $5 of costs. This is the full cost allowance in our simplified model: nothing is deducted twice and no further charges are assumed.
| Part of the record | Calculation | Total, USD |
|---|---|---|
| 16 winning trades | 16 × 25 | +400 |
| 4 losing trades | 4 × (−150) | −600 |
| Result before costs | 400 − 600 | −200 |
| Costs of all 20 trades | 20 × (−5) | −100 |
| Result after costs | −200 − 100 | −300 |
The win-rate claim is arithmetically correct: 16 ÷ 20 = 80%. Yet the record loses $300 after costs, or $15 per completed trade on average. Four larger losses outweigh sixteen smaller gains. We have not discovered a forecasting trick; we have recovered the amounts that a percentage left out.
This arithmetic establishes the outcome of this invented record only. It says nothing about the next 20 trades. Nor does it tell us the percentage return on capital: no starting capital has been specified. To judge the strategy's risk, we would also need position sizes, open exposures, the path of losses and the conditions under which the record was produced. To test how win rate, average win/loss and per-trade friction interact across your own assumptions, use the expectancy calculator and the trading cost & break-even calculator.
A demo chart proves less than it appears to
Return to the chart. Was it a simulation using past prices, a demo account running in real time or an account trading actual money? These are different kinds of evidence. A complete demo record can help explain how a strategy behaves in that environment. It does not establish that every order would have filled on the same terms with real money.
Next ask how the period was chosen. A displayed winning month does not describe omitted months. A screenshot may omit open losses, deposits or costs. The useful follow-up is a complete, dated record with the calculation method and all relevant costs, not another screenshot of the same rising line. CFTC materials discuss the limitations of hypothetical results and warn against AI-based promises of certain profits. [6], [7]
Even a genuine, complete profitable record would answer a historical question. It would not remove future uncertainty. A seller who cannot distinguish those two statements has not substantiated a promise of future income.
A genuine licence number can appear in a false offer
The advertisement's number may belong to a real authorised firm. The next step is to connect that firm to the offer: compare the legal entity named in the agreement, the permission for the service and the contact details with the relevant regulator's official register. A brand name or a familiar trading-platform logo does not complete that connection.
The FCA describes clone firms that copy genuine firms' names and reference numbers while substituting their own contact details. Its guidance is a UK example of why the identity check matters. [23] The applicable register and protection rules depend on the entity and jurisdiction; the same brand may operate through several companies.
Also separate a forecast from a contractual right. A claim that a robot “cannot lose” is a claim about future results. A specified guaranteed-stop service, if available, is a contractual protection with conditions, charges and an identified provider. Calling both a “guarantee” does not give them the same meaning. A licence authorises specified activities; it does not certify that the client's trades will be profitable. [13]
The size of Forex does not validate the offer
Foreign exchange supports payments, funding and hedging as well as speculation. Its large turnover helps describe that activity. It does not tell us whether this seller is genuine, how a particular CFD is priced or whether a strategy makes money after costs. Those questions need their own evidence. The detailed sections below explain market size and liquidity, turnover versus capital and currency delivery versus a CFD.
The same distinction helps with apparently simple slogans about availability. Paying by card abroad on a Saturday and trading a quoted currency product at that time are different services. The ability to make a payment does not establish that the normal wholesale FX market or your particular trading product is open on unchanged terms. Its normal week and product-specific exceptions are explained under “Forex operates 24/7”. [14]
What can we now conclude about the advertisement?
Its headline win rate can be true while the complete result is negative. Its demo chart can be genuine without reproducing real execution. Its licence number can be real without identifying the person offering the service. The market can be large without making that service profitable.
We have enough information to reject the claim that these four items establish a dependable income. We do not have enough to label a particular real firm fraudulent; our offer is fictional. The skill to practise is narrower and more useful: match each statement with the evidence that could actually support it.
Try it: amounts, identities and a break-even rate
Use the hypothetical assumptions above. The first two questions check the main lesson; the third is an optional calculation. Choose an answer, then read the explanation.
Read further: what the 23 claims leave out
The worked example shows how to test one offer. The rest of the article takes the same care with statistics, market structure, order execution and regulation. Use the contents to choose a question; each claim includes the distinction that changes its meaning and the sources used to check it.
Three names, three scopes:
- Forex is the broad market for currency exchange and related contracts, including those used for payments and agreeing a future exchange rate.
- Margin FX describes currency trading backed by margin. The contract structure and legal classification must be checked in the relevant country.
- A contract for difference (CFD) settles a price difference. It can reference a currency pair or other assets. Opening the position does not put the currency into a bank account.
The Australian Securities and Investments Commission (ASIC) explains that margin FX in Australia is generally regulated as a type of CFD. This classification applies to that jurisdiction, rather than establishing terminology for every country. [13] The full service map is in “What is forex?”. In the sections below, OTC means over-the-counter.
The promise of “financial freedom from a small deposit” and the claim that “everyone loses, so all forex is a scam” make a similar mistake: they replace a description of the market with a convenient slogan. The first leaves out costs and risk; the second generalises experience with a particular service to currency conversion, funding and hedging. There is no need to choose between those stories. Establish what the statement refers to and what evidence actually supports it.
23 claims at a glance
The verdict applies to the exact statement in the first column. “False” means the evidence or mechanism contradicts it as stated. “True with an important qualification” describes a rule that applies in a narrower sense.
| Claim | Verdict | What must be distinguished |
|---|---|---|
| 1. “90% of traders lose” | False as a universal number | A losing majority in a study versus a fixed, unsupported 90%. |
| 2. “A large market means easy profit” | False | Market size and client results. |
| 3. “Forex is a casino and pure speculation” | False | Speculation and other purposes of exchange. |
| 4. “Forex is unregulated” | False | No single exchange versus no supervision. |
| 5. “Leverage increases the chance of profit” | False | The size of an outcome and the probability of a correct decision. |
| 6. “An indicator will certainly predict the next move” | False | Describing data and forecasting with certainty. |
| 7. “A robot or artificial intelligence guarantees income” | False | Automated execution and evidence of effectiveness. |
| 8. “Forex is too large to manipulate” | False | Abuse at a specific point and control of the whole market. |
| 9. “Banks or brokers hunt every stop-loss” | False | Possible misconduct and proof in a specific case. |
| 10. “$200 is enough for a steady income” | False | Opening an account and promising earnings. |
| 11. “Forex is one global exchange” | False | An OTC market and individual platforms. |
| 12. “There is one true exchange rate” | False | Price type, timing and exchange terms. |
| 13. “Forex operates 24/7” | False | Weekday trading and weekend access. |
| 14. “Forex is a zero-sum game” | True with an important qualification | The contract’s payouts before costs. |
| 15. “$9.51 trillion is sitting in the market” | False | Daily notional turnover and a stock of capital. |
| 16. “Buying a CFD means buying currency” | False | A derivative and delivery of money. |
| 17. “All forex needs leverage” | False | Conversion using owned funds and a margined position. |
| 18. “Demo profit proves live-account profit” | False | Simulation and actual execution. |
| 19. “Most forex is trading by private individuals” | False | The global market and a retail platform’s customers. |
| 20. “A central bank’s announced rate will last forever” | False | Influence over a currency and a changeable commitment. |
| 21. “Only interest rates determine exchange rates” | False | An important factor and an exclusive explanation. |
| 22. “A broker can quote any price it wants” | False | Own quotes and unrestricted discretion. |
| 23. “Forex is a pyramid scheme” | False | The currency market and fraud using its name. |
1. “90% of forex traders lose”
Verdict: false as a universal number. Studies show many clients lose, but the percentage depends on the population and period.
Table 1 of the Polish Financial Supervision Authority’s (KNF) report for 2025 shows realised losses for 72.2% of clients of domestic entities supervised by its office (UKNF), including Polish and foreign residents. Zero outcomes are excluded; the measure is the net realised result over the year. KNF uses “Forex” to mean the entire OTC derivatives market, rather than currencies alone. The separate Polish-resident table gives 71.8%. [1]
Historical analyses cited by the European Securities and Markets Authority (ESMA) in 2018 indicated that 74–89% of retail CFD accounts lost money in different EU countries. [2] An account is not a trade. A client can close some positions profitably but lose over the full period. Nor do the data describe every FX participant or lifetime trading results. The lesson on retail CFD protection develops product scope and safeguards.
| Year | Losing clients |
|---|---|
| 2021 | 71.9% |
| 2022 | 79.1% |
| 2023 | 73.3% |
| 2024 | 70.6% |
| 2025 | 72.2% |
Source: UKNF report for 2025, Table 1. [1] The series shows a changing percentage, not a fixed probability that one person will lose on a future trade. It is neither a survey of all investors worldwide nor a broker ranking.
A provider’s own warning must be read separately: which legal entity publishes it, which product and period it covers, whether it counts clients or accounts, and when it was updated. A lower percentage of losing accounts does not itself demonstrate better execution or lower risk. Clientele, product use and measurement periods can also differ.
Three trades and one result
A separate calculation: one person closes three trades on one account with results of +$100, +$100 and −$350. Two of three are profitable, but the sum is −$150. In this small model, the winning-trade proportion is two thirds; the person’s overall result for the assumed period is negative. If the amounts exclude costs, those must be subtracted. These are not KNF client data.
Read correctly, the annual table answers how many sampled clients finished the year with a realised loss. It does not show how often their individual decisions were correct or their largest loss during the year. Two accounts held by one person should not automatically be treated as two people either. Comparisons must preserve the methodology’s unit: client, account or trade.

A profitable account does not establish its owner’s overall profit
A second model separates accounts from people. One person makes +$38 on the first account and a combined −$2,400 on two others in the same quarter. The total is −$2,362. A dataset covering only the first account still contains a profitable account. This is a separate example, not regulatory data. It shows why one firm’s statistics do not automatically answer a question about a person’s overall results across intermediaries.
The percentage of positive results does not show their size either. An account with +$1 and an account with +$10,000 can fall into the same “profitable” category despite very different financial significance. Equally, a small loss and the loss of most capital are not economically equivalent. Assessing regular income would also require amounts, capital, risk and a longer history. Neither a profitable-account percentage nor one positive year independently establishes a persistent edge.
The monetary scale also appears in ESMA’s historical March 2018 release: cited national-supervisor analyses reported average losses per client ranging from €1,600 to €29,000 across jurisdictions. [2] This is a range from historical analyses, not today’s worldwide average or a forecast for every person. It cannot establish how much a new $200 account will lose in its first weeks.
Methodology can change even the meaning of “result”. In the US example of CFTC rules in the 2025 edition, §5.5 requires quarterly disclosures, while §5.18(i) includes realised and unrealised results, charges and specified income; deposits and withdrawals are not trading profit. Zero is classified as unprofitable. This differs from the cited annual Polish UKNF report, which excludes zero outcomes and examines realised results. These measures cannot be combined into one “global success rate”. [21], [22]
| Jurisdiction / Regime | Unit Counted | Product Scope | Reporting Window & Calculation Basis | Treatment of Zero Result & Key Distinction |
|---|---|---|---|---|
| EU (ESMA product intervention & national measures) [2] | Retail client accounts of a specific CFD provider | Retail CFDs (including rolling spot FX CFDs) | Provider-specific calculation over the preceding 12 months (updated quarterly); historical 74–89% range from ESMA’s 2018 analysis applies only as a fallback when a firm had no open retail CFD positions in the prior 12 months | Measures whether an account had a net negative CFD trading result over the window; see ESMA retail protection. |
| United Kingdom (FCA COBS 22.5) [2] | Retail client accounts of that specific provider | CFDs and restricted speculative investments | Provider-specific percentage of retail accounts that lose money when trading CFDs with that provider | Mandatory firm-specific percentage in the standardised risk warning; cannot be averaged across firms into a market-wide win rate. |
| Australia (ASIC Instrument 2020/986 & Moneysmart) [13] | Retail client accounts / retail CFD clients | Retail CFDs (including margin FX classified as a CFD in Australia) | Standardised risk warning and product-intervention framework (extended under ASIC Instrument 2022/259) | Emphasises that most retail clients lose money on CFDs and that a licence does not protect against market losses; see regulatory architecture. |
| United States (CFTC 17 CFR §5.5(e) & §5.18(i)) [21], [22] | Non-discretionary retail forex accounts maintained by an RFED or FCM | Off-exchange retail foreign currency transactions | Quarterly disclosure for each of the four most recent calendar quarters; includes both realised and unrealised net trading results, fees/charges and specified interest/income (excluding deposits and withdrawals) | Accounts with a zero result are classified as unprofitable (not profitable). |
| Poland (UKNF annual market study) [1] | Active clients across domestic UKNF-supervised entities | All OTC derivatives executed through those firms (not currency pairs alone) | Annual aggregate study (e.g. 2025: 72.2% losing clients overall; 71.8% among Polish residents), based on realised net annual results | Clients with a zero annual result are excluded from the profit/loss split. |
A risk warning should be read neither as a verdict on one person nor as a contest to “join the profitable minority”. It does not explain every loss in terms of costs, selected leverage, decision frequency or failure to follow a plan. Nor does it establish how many participants live entirely from trading. Those questions need separate data, rather than a more forceful interpretation of one percentage.
2. “It is easy to profit in the largest market”
Verdict: false.
Turnover describes the value of agreed trades. It does not by itself explain whether an offer lets a client profit after costs. Results depend on price movements, contractual terms, position size and charges.
The distinction is supported by the data: the BIS global-turnover survey and KNF client-outcome analysis measure entirely different things. The former cannot replace the latter. [1], [3] Market-wide liquidity also does not guarantee execution of every size, pair and moment. The lesson on market size explains turnover methodology.
Model: the same midpoint, a different client price
Consider an ordinary euro purchase without leverage. Two fictional providers quote the following prices at the same moment. Both can execute €1,000, charge no other fees and maintain their quotes throughout the example. “Buys” and “sells” describe the provider: a client buying euros pays the “provider sells” price.
| Provider | Buys €1 | Sells €1 | Cost of €1,000 |
|---|---|---|---|
| A | $1.1000 | $1.1025 | $1,102.50 |
| B | $1.0950 | $1.1075 | $1,107.50 |
Both quote midpoints are $1.10125, but the client pays $5.00 more at B. Immediately selling back at unchanged prices would yield $1,100.00 at A and $1,095.00 at B: $2.50 and $12.50 below the respective purchase costs, despite an unchanged midpoint. This is the effect of the spread, the difference between buying and selling prices.
An actual offer also needs assessment of possible commission, amount and execution conditions. UKNF explains spreads and intermediary margins in retail derivatives pricing, while the US Commodity Futures Trading Commission (CFTC) highlights a dealer’s specific prices and terms in US retail OTC trading. [9], [10] Ordinary conversion illustrates the basic distinction: huge global turnover and a good rate for one client are separate facts.
Liquidity helps execute a trade; it does not select a profitable direction
A large company converting a substantial amount needs quotes that allow it to distribute execution and limit the order’s market impact. For a small account, more pressing questions may be the cost of each trade, the minimum position and whether the method remains viable after those costs. These are different problems. Being able to buy and sell quickly does not mean the price difference will favour the buyer.
Institutional advantages also cannot be reduced to “they know where the exchange rate is going”. Available channels, funding terms, data, amounts and execution methods may differ. The BIS Markets Committee report on execution algorithms describes tools that improve liquidity matching in a fragmented market but shift some execution risk to the user. [26] That concerns the benefits and costs of execution services, rather than proof of an ability to profit from price direction.
An analogy with a game against other participants can highlight competition and fees, but cannot explain all forex. The counterparty need not be pursuing the same speculative method in the opposite direction. A dealer may hedge several clients’ needs, while an exporter reduces revenue risk. Market size, the counterparty’s purpose and the effectiveness of one’s own method must be assessed separately.
3. “Forex is a casino, and every transaction is speculation”
Verdict: false.
A company paying a foreign invoice needs currency regardless of whether it expects appreciation. An exporter can agree the conversion rate for future revenue to reduce uncertainty. This is currency-risk hedging. Banks and institutions also use currencies for funding and investment services. BIS analyses describe different transaction motives. [4]
Speculation — accepting risk in expectation of profit — also exists. A participant may act impulsively and treat trading as gambling. That behaviour does not define the entire market’s function. Examining the “casino” claim starts with whether the author is judging the market, a product or a person’s behaviour. The lesson on forex’s economic role separates its economic purposes.

The same instrument can serve different needs
In the final BIS data, FX swaps accounted for approximately $4.02 trillion of average daily turnover in April 2025, or about 42.2% of the total. [3] These contracts combine a currency exchange with an agreed reverse exchange on a second date; they are not the same as a CFD account’s overnight charge. The large share of an instrument used, among other things, for funding helps explain why all forex is not simply a collection of bets on tomorrow’s exchange rate. It does not, however, identify a single purpose for every such contract.
A bank may need dollars for a specified period and use an FX swap for funding. A fund may use a similar structure within a broader investment position whose outcome depends on exchange rates and interest rates. An instrument’s name alone cannot reveal the entire position’s purpose. Likewise, spot can serve an invoice or speculation, while a forward can hedge existing revenue or create new exposure. An instrument table is therefore not a table of “legitimate economic activity versus gambling”.
The distinction is clearest in a need that exists before the contract. An importer has a foreign-currency payment, a fund owns foreign assets, and a bank must manage funding maturities. A transaction can reduce their pre-existing uncertainty even if its own subsequent valuation is negative. A speculator deliberately accepts exposure to profit from a change. None of these descriptions removes the need to examine costs and counterparties; they show why every activity cannot be judged with the single word “casino”.
4. “Forex is unregulated”
Verdict: false.
No single organisation runs the whole market, but this does not mean there is no law. Supervision depends on the entity, service and jurisdiction — the legal system governing the activity. A firm offering client CFDs is assessed differently from a bank contracting with another bank.
Evidence of regulation includes the retail CFD restrictions agreed by ESMA in 2018 and enforcement action against intermediaries. [2], [5] A licence covers a particular entity and service. Client profit still depends on the trade’s outcome. Status and conduct must be checked for the specific firm; the lesson on licence verification explains how.

What does a licence establish, and what does it not guarantee?
Before depositing, connect three facts: the entity named in the agreement, permission for the offered service and that entity’s genuine contact details. A group logo or licence number in an advertisement is insufficient. The UK Financial Conduct Authority (FCA) warns about clone firms: fraudsters copy authorised firms’ names and numbers but use different contacts. The register also helps compare the website address and contact details. This is a UK supervisory example, not a global licence confirmation. [23]
Separately examine client-money arrangements, negative balance protection, complaints and any compensation scheme. Protection against a negative balance limits a specified client liability; it does not guarantee preservation of the deposited capital. Separation of client money from the firm’s own assets and compensation schemes also have their own conditions. They do not insure against market losses. Professional status or moving the contract to another jurisdiction requires checking those arrangements again, rather than looking only at a new leverage limit.
The absence of one global regime does not justify treating every non-EU firm as fraudulent. It would be equally wrong to regard every registered company as an intermediary authorised to offer the product. Corporate registration, financial permission and one client’s rights are separate questions. Depending on where the contracting entity is supervised, start with the relevant public register and warning list — such as the FCA (UK), CFTC/NFA (United States), BaFin, CySEC or KNF (EU), or ASIC (Australia).
The FX Global Code supplements the law
The wholesale market also has the FX Global Code, maintained by the Global Foreign Exchange Committee (GFXC). The December 2024 version contains 55 principles of good practice. It explicitly states that it creates no legal obligations and does not replace local regulation. A public statement of commitment is therefore different from permission to provide a retail-client service. [24]
5. “More leverage increases the chance of profit”
Verdict: false.
Leverage allows exposure greater than the posted collateral. It does not change the direction of the currency move. It amplifies the effect on account capital, whether the outcome is positive or negative. Leverage limits formed part of ESMA’s 2018 intervention. [2]
A simple calculation without costs: with $1,000 capital and $10,000 exposure, a 1% price move changes the position’s value by about $100, or 10% of capital. Either sign is possible. A larger potential result does not mean greater accuracy. Actual contracts add costs and close-out rules. The lesson on leverage and margin explains the mechanism and limits.
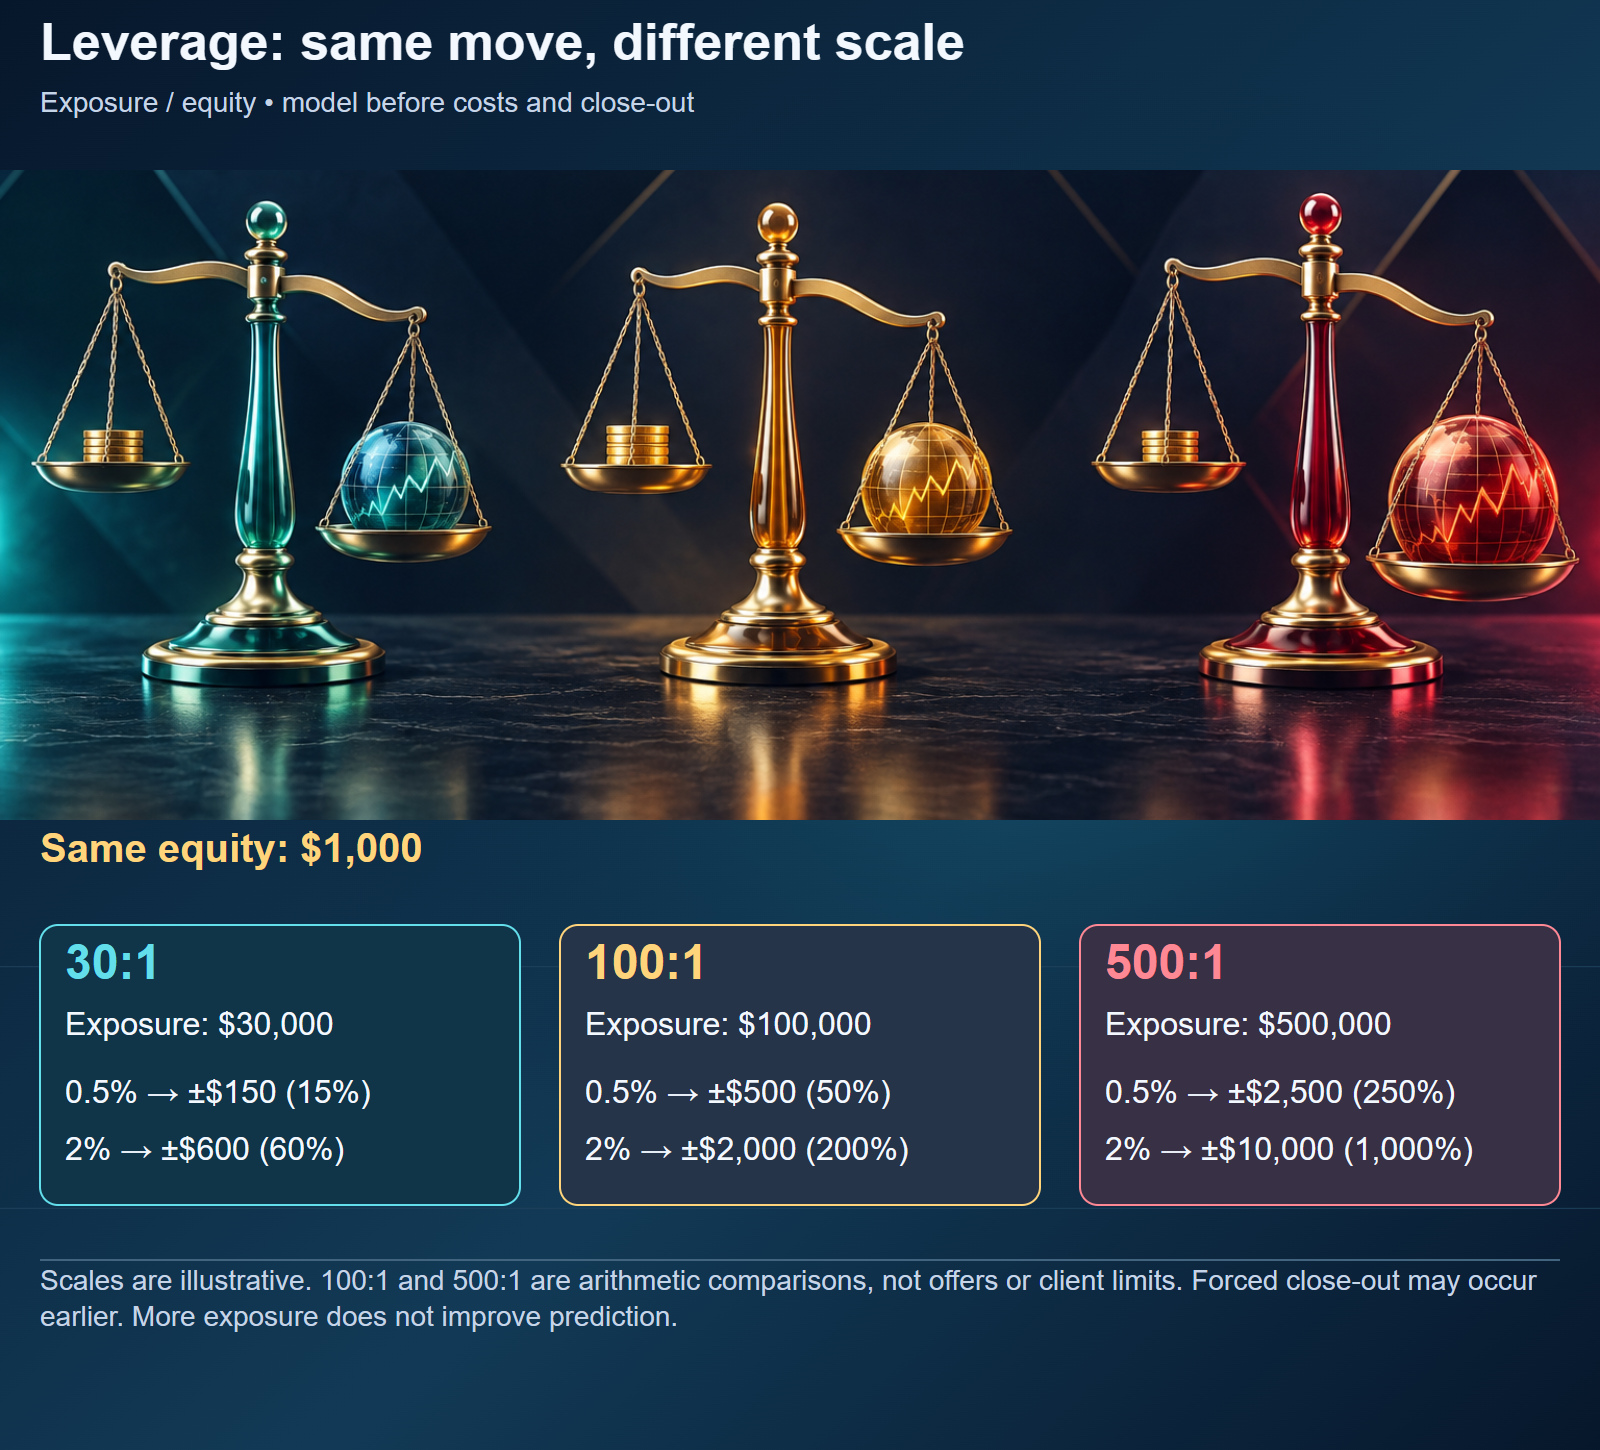
Available leverage and leverage actually used
A specification’s limit describes the position size that a deposit can support. Actual account leverage depends on the exposure chosen relative to capital. Two people with access to 30:1 can hold very different positions. This separate model assumes full use of each stated ratio and the same $1,000 capital.
| Exposure / capital | Exposure | 0.5% move | 2% move |
|---|---|---|---|
| 30:1 | $30,000 | ±$150 (15% of capital) | ±$600 (60%) |
| 100:1 | $100,000 | ±$500 (50%) | ±$2,000 (200%) |
| 500:1 | $500,000 | ±$2,500 (250%) | ±$10,000 (1,000%) |
The 100:1 and 500:1 rows are mathematical comparisons, not offers or permitted limits for a particular client. A result exceeding capital does not mean a live position will remain open unaffected: forced close-out may occur earlier. Negative balances and protections depend on product, client status, agreement and jurisdiction. At full 500:1 exposure, a 0.2% move corresponds to the entire capital before costs; it is not a guaranteed close-out level.
The historical ESMA retail CFD intervention of 2018 included a 30:1 limit on major currency pairs, 20:1 on other pairs, margin-based close-out, account-level negative balance protection and restrictions on incentives. [2] These safeguards limit specified risks but do not make a position profitable. Current law and client classification must be checked for the particular entity and country, rather than treating a historical release as one global specification.
A larger position also changes the room available for a stop
A high available limit does not require a large position. If the position is increased while the permitted monetary loss stays unchanged, however, the stop distance must decrease. A separate model: with a $20 loss budget and a $1 pip value, a 20-pip stop corresponds to $20 before costs. At $4 per pip, the same amount accommodates only five pips. This is an arithmetic relationship, not a recommendation for a stop or position size.
In the second case, even a smaller adverse move can meet the trigger condition. This does not show that “retail traders always lose to noise”; it shows that position size, stop distance and the risk budget must be considered together. A stop does not repair excessive exposure, particularly when its price is not guaranteed. The 2015 SNB case, explained later in the article, also illustrates sudden changes in policy and liquidity. You can model required collateral and position volume for a chosen stop distance in the margin and leverage calculator and the position size calculator.
6. “A technical indicator will certainly predict the next move”
Verdict: false.
An indicator transforms specified data under a chosen rule. Its signal can be a hypothesis for testing; a chart’s appearance alone does not prove effectiveness. A rule’s usefulness requires evaluation on appropriate data after costs.
The issue is evidence: does the presentation show the full period, costs, unsuccessful trades and results outside the data used to select the rule? The CFTC explains that selecting successful trades and concealing the nature of results can mislead. [6] This evidence standard is useful here, although the cited document governs advertising of specified US services. The lesson on technical analysis introduces the approach; testing covers verification.
A separate presentation example: ten successful signals say something about those ten signals. Without the total signal count and all outcomes, they cannot establish the complete rule’s success rate. Selected historical successes can look convincing even when the omitted portion lost money. A complete result calculation comes first; detailed examination belongs to the testing workshop.

What does technical-analysis research actually establish?
The certainty myth should not be replaced with the opposite claim that no technical rule has ever been profitable. Park and Irwin’s 2007 review found positive, negative and mixed results. They also identified testing problems: selecting rules after observing history, data snooping, and difficulty assessing costs and risk. This is a historical review of different studies, rather than a test of a reader’s current indicator. [25]

Chart analysis can help specify a condition precisely: “after a candle closes above the level, I examine a defined scenario”. This differs from “this level will certainly stop the price”. If a pattern can be named only after subsequent candles are observed, hindsight can contaminate the assessment. A credible test must reconstruct what was known at the decision time, rather than select the neatest examples afterwards.
Similarly, labels such as order block, fair value gap or “smart money” are not themselves evidence that a particular bank was present or that its intentions are known. First define the area unambiguously, specify how it is identified, and evaluate every signal. A new name does not remove those requirements; an old name does not establish that a method is useless either. Observed order clustering, discussed under stop cascades, concerns a microstructure mechanism, rather than a guaranteed rebound from every rectangle on a chart.
In a hypothetical example, support may attract buy orders, while conditional sell orders sit below it. If the price crosses that area, triggered orders may reinforce the fall instead of stopping it. The people placing those orders need not all know one another, and a drawn line is not a physical barrier. Inferences about direction, execution conditions and someone’s intention require three different kinds of evidence.
Why can getting the direction right be insufficient?
A separate EUR/USD cost model: one lot is €100,000 and one pip, 0.0001 USD per EUR, is worth $10 for that position. Assume a 0.8-pip spread cost, $7 commission for the complete opening and closing, and $2 total adverse slippage. These are hypothetical parameters, not current or typical charges. The position closes the same day, without funding costs.
| Item | USD amount | Pip equivalent |
|---|---|---|
| Spread | 8 | 0.8 |
| Round-trip commission | 7 | 0.7 |
| Total adverse slippage | 2 | 0.2 |
| Total | 17 | 1.7 |
| 1-pip gross gain minus costs | 10 − 17 = −7 | −0.7 |
| 5-pip gross gain minus costs | 50 − 17 = +33 | +3.3 |
The spread is counted once as the cost of the complete round trip at the assumed unchanged midpoint; another $8 is not added for closing. The $7 commission explicitly covers both sides. If a platform result already includes spread or commission, these are not deducted again. Overnight financing requires a separate rate, dates and charging schedule: “five days” does not specify one charge at every firm.
The example shows why results need to be assessed after costs, but does not prove that a strategy with a five-pip gain is always unprofitable. The complete series of gains and losses is needed. In a hypothetical rule with half the trades gaining five pips and half losing five, the pre-cost average is zero; after a fixed 1.7-pip cost per trade it is −1.7 pips. The winning percentage alone cannot establish a positive result.
Overnight costs and the expected value of the complete series
Extend the same cost model, keeping the $17 opening-and-closing cost. Additionally assume a charge of $3 per equivalent funding day and five such days in total. Funding then costs $15 and the complete cost is $32, or 3.2 pips for the assumed one EUR/USD lot. This is a separate constant-rate model, not a tariff. “Five funding days” need not mean five postings or five calendar nights: charging schedules, multiple-accrual days and holidays come from the specification.
| Item | No funding | Five equivalent days at $3 |
|---|---|---|
| Spread, commission and slippage | $17 | $17 |
| Funding | $0 | $15 |
| Complete cost | $17 = 1.7 pips | $32 = 3.2 pips |
| Net result for a five-pip gross gain | 50 − 17 = +$33 | 50 − 32 = +$18 |
Assessing a strategy requires an average over the complete series. In a simplified model, expected value per trade is: probability of a gain × average gain − probability of a loss × average loss − average cost. With a hypothetical 55% of trades gaining ten pips and 45% losing eight, the gross average is 0.55 × 10 − 0.45 × 8 = 1.9 pips. A 1.7-pip cost leaves 0.2 pips; a 3.2-pip cost changes the result to −1.3 pips. The assumed frequencies are not a forecast. The calculation shows how the same distribution of gross outcomes changes after costs.
A positive overnight accrual is also only one item in the result. Hypothetically, +$12 of funding does not offset a −$100 price change: together they give −$88 before other costs. A positive rate today does not guarantee the same rate tomorrow. A positive “swap” on a CFD platform and an institutional FX swap are different things despite the similar terminology. To test how spread, commission and multi-day financing shift net expectancy, use the trading cost & break-even calculator and the swap calculator.
7. “A robot or AI guarantees regular income”
Verdict: false.
A program can execute specified rules quickly and consistently. This does not mean those rules are profitable after costs or will work in new conditions. Calling a tool “AI” does not replace risk information, testing methods and actual results.
In its 2024 advisory, the CFTC describes fraud marketed as automated systems guaranteeing exceptional profits. [7] In those cases the promise served fraud. Automation can be an ordinary order-entry tool, but its effectiveness needs checking like a manually executed method. Strategy auditing explains assessment of results.

Automated execution, HFT and a profit-making method
Electronic trading describes the channel through which a contract is agreed. An algorithm executing a large order can split it into smaller parts to limit cost without forecasting direction. HFT is a particular type of fast activity, not a synonym for every program. An electronic-turnover percentage is therefore neither an “AI” percentage nor evidence of profitable client robots.
An automated-system presentation should show complete history, costs, maximum drawdown, open positions and results outside the sample used to select parameters. Testing thousands of settings on the same history encourages overfitting: the winning rule may describe past cases well without identifying a persistent relationship. Neither the tool’s name nor its creator’s high budget removes that problem.
A doubling model: capital requirements also rise
A separate arithmetic example, not a description of all robots: a strategy doubles the next stake after a loss. Successive losses of $10, $20, $40, $80 and $160 have already lost $310. The next stake would be $320. After ten losses, the sum is 10 × (210 − 1) = $10,230 and the next stake is $10,240. Each loss is assumed to equal its stake; costs and position limits are excluded.
This does not calculate the probability of that sequence. It shows only how quickly capital needs grow. Real account balances, liquidity and permitted positions have limits; a subsequent favourable move is not guaranteed. An order grid can similarly conceal mounting losses in open positions: a chart of closed profits alone does not describe account equity fully.
How can executing a rule be separated from evidence that it works?
Legitimately sold software can improve a workflow without promising independent profit. The price of a program, or the fact that it is sold, does not establish whether its rule works. More specific checks are needed: whether results are simulated, whether every position is included, whether costs are counted, and which data were used to choose settings. An advertisement promising “30% every month without risk” makes a very strong claim. A separate calculation: $1,000 growing by 30% each month for 12 months becomes 1,000 × 1.312 ≈ $23,298 with full reinvestment. This is the advertisement’s arithmetic, not evidence that the outcome is attainable.
Overfitting need not involve fraud. An author can test thousands of combinations and select the one that best fitted historical noise. Presenting the same period as a “test” then uses the same information twice. Out-of-sample results should come from data not used to select the rule; walk-forward means successive stages of fitting on earlier data and evaluating on the periods that follow. Each stage must preserve information order. Repeatedly revising the rule after seeing test results compromises that separation again.
Execution conditions also matter. A backtest with a constant narrow spread may not reproduce wider spreads during a liquidity interruption, while a simulated order does not establish acceptance of a live order. Last look is an opportunity to accept or reject a trade request in a specified electronic model; Principle 17 of the FX Global Code calls for transparency about its use. It is not a mandatory feature of every robot and product. [24] The lesson on market functioning explains channels and confirmation. For a structured out-of-sample and walk-forward audit checklist, see the strategy testing protocol.
A smooth closed-profit chart can conceal an open loss
An order grid places positions at successive price levels. If a method closes small gains when prices return but retains positions against a sustained move, its closed-results chart can rise alongside an unrealised loss. Hypothetically, starting with $1,000, then making $300 of closed profits while carrying a −$500 open result leaves $800 equity before further costs, despite a $1,300 balance. The balance–equity distinction matters more here than the chart’s appearance.
Not every grid doubles positions, and not every robot uses a grid. If a system combines a grid with doubling after losses, however, exposure and collateral requirements can rise together. A prior series of small gains does not establish survival of the next sustained trend, wider spread or program outage. Assessment must include open risk, rather than only closed trades and a selected calm period.
8. “Forex is too large to manipulate”
Verdict: false.
Case study: collusion around reference rates
On 20 May 2015, the US Department of Justice announced plea agreements involving Citicorp, JPMorgan, Barclays and the Royal Bank of Scotland (RBS). The case concerned collusion in dollar and euro trading. From December 2007 to January 2013, traders at those banks used a private chatroom and coded language to coordinate activities. They attempted to influence, among other things, the fixing: the determination of a reference rate under a specified procedure. [8]
Why did the selected time matter? Some client orders were executed using the fixing rate. Changing that reference could therefore change the price a client paid. The Department of Justice describes coordinated conduct around fixings and agreements to refrain from some bids or offers to avoid harming another cartel member’s position. Competitors limited competition between themselves. [8]
The outcome included criminal plea agreements and multibillion-dollar fines. The release refers to five banks, but the fifth agreement — with UBS — concerned a LIBOR plea, the interest-rate benchmark. It should not be presented as the same currency charge against a fifth bank. [8]
Benchmark manipulation does not mean control of all forex. The case proves a particular abuse by specified entities over a stated period. A large market still has points and moments important to the valuation of many contracts. This explains why its size did not provide sufficient protection. The lesson on market functioning explains structure and price sources.

Pressure on a defended exchange rate differs from proven collusion
The sterling episode of 16 September 1992 illustrates another limit: defence of an exchange-rate commitment is not unconditional. The Bank of England described a conflict between the UK economy’s needs and the policy required to maintain sterling within the European Exchange Rate Mechanism (ERM). After intense pressure and intervention, the UK suspended sterling’s ERM membership. This account does not establish that one investor controlled the entire market; it illustrates conflicting policy goals. [27]
Distinguish the impact of a large order, many participants’ response to a vulnerable policy, and deliberate misconduct. A rate change following a trade does not establish manipulation. Conversely, daily turnover across all instruments and pairs is not a measure of available depth during one benchmark’s short window. “The market is enormous” therefore neither invalidates fixing-case findings nor justifies automatically accusing a large-trade participant.
9. “Banks or brokers hunt every stop-loss”
Verdict: false. Misconduct is possible, but a closed position alone is not proof.
A stop-loss operates when its specified price condition is met. Assessing activation requires knowing whether the condition concerns the bid or ask and checking timing and execution history. Another platform’s chart may display another price type. A rapid move can cause slippage: execution at a different price from the one expected.
Regulators have documented actual problems. The CFTC’s FXCM case of 3 October 2011 describes asymmetric slippage: adverse price movements were passed to customers while favourable movements were not passed through in the same way. [5] This supports checking execution, rather than confirming “hunting” in an unrelated trade. Documented bank collusion likewise does not prove anything about every stop-loss. Broker disputes explains documentation and complaints; order types explains the mechanics.

An example bid/ask model and available trigger conditions are described in OANDA’s documentation. [15]
Stop activation and the execution price are two stages
A separate model of a stop executed as a market order: a long €10,000 EUR/USD position opens at 1.1000 USD per EUR and has a bid trigger of 1.0990. If the price crosses the condition and the first available executable bid is 1.0950, closing produces 10,000 × (1.0950 − 1.1000) = −$50 before costs. Closing exactly at 1.0990 would produce −$10; the $40 difference is adverse slippage relative to the stop level. Assume a gap in available quotes, full execution of that amount and the stated contractual rules. This does not describe an actual data release.
The market need not offer execution at every intervening price. During rapid repricing, quote reduction or a trading break, the condition can be met after the expected offer is no longer available. This explains possible slippage without establishing whether a firm executed the particular order properly. A stop-limit has a different trade-off: it limits the permissible execution price but may remain unfilled. A guaranteed stop, if available, is a separate contractual promise with its own costs and conditions.
Available quotes can change around a settlement-day transition or important announcement. There is no need to infer deliberate targeting of one person; equally, every wide spread cannot be justified in advance. A credible comparison matches the quoted side, instrument, timestamp and time zone, volume and trigger condition. Only then can slippage symmetry, execution-policy compliance and differences from available offers be examined.
Research on order cascades does not establish universal collusion
In a July 2002 New York Fed staff report, Carol L. Osler examined how triggered stop-loss orders can accelerate currency moves. The mechanism is positive feedback: crossing a level adds buying orders during a rise or selling orders during a fall. In the examined data, moves could be especially rapid around levels with documented stop clusters. [20]
This is empirical support for one possible mechanism, not proof that every broker sees and deliberately activates every order worldwide. The study has its own sample and period. Clustering can amplify moves without collusion; intentional abuse requires separate evidence. A chart’s support line is likewise not an obligatory barrier that stops prices merely because it has been drawn.
Why can a bid chart omit the stop’s trigger?
Under a bid/ask convention, a short position closes by buying at ask and a long position by selling at bid. Assume hypothetical bid 1.1000 and ask 1.1002; a short position’s stop uses ask 1.1005 as its condition. If bid stays at 1.1000 but ask rises to 1.1006, the condition can be met without that high appearing on a bid-only chart. This is a separate price model, not an actual incident. A platform may allow different trigger conditions, which must be checked in its documentation and agreement. [15]
The mechanism does not establish whether a particular spread increase was proper. Assessment requires timestamped price logs, order type, trigger condition, execution confirmation and comparable data. An ordinary stop and guaranteed stop have different contractual terms; the word “stop” does not create one universal price promise.
10. “$200 is enough to earn a steady income”
Verdict: false as a promise of steady income.
The minimum amount needed to open an account is a service condition, not a calculation of future earnings. Income would require repeatable positive results after costs, including losing periods. None of those features follows from a minimum deposit.
KNF client outcomes do not justify guaranteed regular withdrawals. [1] Assessing the amount required for a goal would need the particular method’s results and risk. “Making a living from a small account” requires evidence, full risks and costs; enlarging positions through leverage does not supply missing evidence. Position sizing explains capital, positions and losses.
Scale can be calculated without a forecast. Suppose capital is $200 and the expected withdrawal $100 per month. The withdrawal alone equals 50% of capital every month, before costs or balance changes. This is an arithmetic example, not a target or suggested return. It shows why a small-deposit advertisement should immediately be compared with the income promised. A small deposit and an appealing withdrawal can hide a very demanding assumption.

A loss and the required recovery have different denominators
A separate model: a $1,000 account has $800 after a 20% loss. Returning to $1,000 requires 200 / 800 = 25%, rather than 20%. After a 50% loss it requires 100%. This is changing-denominator arithmetic without a forecast. It does not prove that a larger account always succeeds; it shows the cost of chasing recovery. You can test any loss percentage and the required recovery gain in the drawdown recovery calculator.
A “funded account” also requires reading the agreement
A paid test or evaluation challenge may display a large notional balance, but that is not automatically money given to the participant for withdrawal. Check whether orders are simulated or real, who owns the capital, what the loss limit means, and payout terms and fees.
A hypothetical account described as $100,000 has a $5,000 total loss limit. That $5,000 is room before breaching a condition in this example, rather than the full order value or the participant’s own funds. It does not make the account equivalent to a $5,000 brokerage deposit: daily limits, trailing limits, test rules and payout claims may work differently. An advertised notional should not be compared with a deposit without identifying the service structure.
A small account: minimum position size matters as well as the deposit
Take an explicitly assumed specification: the minimum is 0.01 EUR/USD lot, contract size is €100,000 and the account has $200. The minimum position is €1,000; one pip of 0.0001 USD per EUR is worth $0.10. A 30-pip stop corresponds to $3, or 1.5% of capital before costs and possible slippage. With a 1% budget, or $2, this position would accommodate only 20 pips before costs. This is a separate model without a recommended account size or stop; actual minimums and increments may differ.
At an additional hypothetical EUR/USD 1.10, exposure is $1,100, while required margin at 30:1 would be about $36.67. The margin required to maintain the position is not the planned loss, however, and does not replace risk calculations. That is why “you can start with $200” does not answer whether available positions, costs and the planned range of fluctuations can be matched to the user’s purpose. Use the pip value calculator to check how minimum lot steps translate into monetary risk per pip.
A small account is not automatically a mistake, and a large one does not provide skill. The problem arises when the desired withdrawal requires exposure beyond the account’s capacity or pressure to recover losses quickly. Hypothetically, 2% of $200 is $4. Comparing that amount with someone else’s screenshot showing a $500 gain also requires comparing capital and risk. Another person’s monetary trade result alone is not a fair benchmark.
A losing sequence can occur even in a method with a positive average
A separate calculation assumes a loss of 2% of current capital on each losing trade, without additional costs. After ten consecutive losses, 0.9810 ≈ 81.71% of initial capital remains: a drawdown of about 18.29%. After twenty, about 66.76% remains and the loss is 33.24%. Returning from that level requires a gain of about 49.79% on the remaining capital. Percentages of the original amount and a smaller amount have different denominators.
This models loss size, rather than its probability. The winning percentage alone does not describe dependence between trades, changing conditions or the worst outcome sequence. Increasing stakes to recover more quickly can worsen drawdown further. Proportionally reducing risk does not guarantee success either: a minimum permitted position can limit further exposure reductions. To see how losing streaks and trade-order variance affect equity paths at a given win rate, run the Monte Carlo simulator.
The test fee and payout conditions are part of assessing an offer
The nominal “$100,000” in the challenge example above must be read alongside the daily limit, total limit, equity definition and payout rights. A trailing limit may depend on the highest value reached, while a fixed limit uses a different base. Especially important questions are whether an unrealised loss counts as a breach and whether a new high changes the lower boundary. These are questions for the specific firm’s agreement, rather than one rule for all offers.
Repeated paid tests also have an economic cost. At a hypothetical $200 fee, five purchases cost $1,000 regardless of the number displayed as a simulated balance. Without credible data, one pass rate, revenue model or legal classification should not be attributed to the entire industry. Simulated-account structure, live execution and a payout claim are separate questions; the familiar “prop trading” label answers none of them. You can compare nominal balance, actual drawdown room and repeated fee hurdle rates in the prop challenge calculator.
11. “Forex is one global exchange”
Verdict: false.
OTC trades are agreed between parties outside one common exchange. There are different platforms and contact channels. Exchange-traded currency futures contracts and options also exist. Using a trading program alone does not identify which segment receives the contract.
The CFTC’s retail OTC advisory explicitly distinguishes connection to a dealer from connection to an exchange. [9] It concerns a specific US segment; not every description should be applied to every instrument worldwide. The first lesson explains OTC, exchanges and platforms.
12. “There is one true exchange rate; everything else is fraud”
Verdict: false.
Before comparing rates, establish what they describe. Bid and ask are different sides of an offer. A reference rate need not be an executable price. Timing, amount and instrument also matter: delivered currency and a CFD quote can have different terms. KNF explains CFD pricing in relation to the underlying and the firm’s margin. [10]
Not every difference is abuse, but “spread” does not justify every difference either. Departures from comparable offers require an explanation of pricing and execution rules. The CFTC recommends checking prices in independent sources. [9] Lesson 1.1 compares rate types; the lesson on bid and ask explains quote notation.
13. “Forex operates around the clock, seven days a week”
Verdict: false.
The main market activity moves between financial centres on business days. “Around the clock” approximates the trading week, not a guarantee of continuous Saturday and Sunday exchange. The Australian Foreign Exchange Committee (AFXC) describes normal trading from Monday morning in Sydney to Friday afternoon in New York, with no single fixed daily session. [14] A particular instrument’s specification determines its hours.
Placing an instruction in a weekend app does not necessarily mean execution on an active FX market then. The rate can reopen at another level after a break. Forex should also not be equated with a similarly named synthetic product. The lessons on 24-hour market structure and weekly cycles explain schedules and breaks.
“Open” also does not mean “equally liquid”. A pair’s activity depends on operating centres, holidays, announcements and available quotes. There is no single best hour for every currency or year-round conversion to one local time zone. Countries change their clocks on different dates. Order analysis therefore needs a time zone, while specifications should distinguish trading hours from funding-accrual schedules.
14. “Forex is a zero-sum game”
Verdict: true with an important qualification — for a suitably defined contract’s outcome before costs.
In a simple price-difference contract, one party’s gain corresponds to the other’s loss. This is the payout calculation for that agreement. After commission and other charges, the combined results of the fee-paying parties need no longer be zero. KNF’s examples illustrate the CFD mechanism. [10]
What exactly are we adding? A numerical example
Two parties agree a hypothetical contract settling in dollars the change in €1,000’s price. The initial reference is $1.10 per euro; settlement price is $1.20. A receives the positive difference and B pays it. The difference is 1,000 × (1.20 − 1.10) = $100. A gains $100, B loses $100 and the contract payouts total zero. This is a calculation model rather than a live quote or offer.
Suppose each additionally pays a separate service provider $5. The calculation’s scope changes:
| Item | Before the fee | After the fee |
|---|---|---|
| Party A | +$100 | +$95 |
| Party B | −$100 | −$105 |
| Total A and B | $0 | −$10 |
| Service provider revenue | Outside the contract payout | +$10 |
The money has not disappeared. Participants paid for a service; their combined result is negative by that amount. Adding the provider’s revenue makes these flows total zero again. “Negative-sum after costs” here describes two fee-paying contract parties rather than the entire economy.
The economic-benefit calculation is different. A company can accept a negative hedge outcome while benefiting from a higher export receipt. The combined effect matters rather than the isolated contract. Currency exchange can also let both parties make a needed payment. “Zero-sum” therefore requires identifying what is being summed. Forex’s economic role develops the distinction.
15. “There is $9.51 trillion of capital in forex”
Verdict: false.
The final BIS annex published in June 2026 for the 2025 survey reports approximately $9.51 trillion of average daily global OTC FX turnover in April 2025. It is transaction notional after removing domestic and cross-border interdealer double-counting: the net-net basis. It covers different currency instruments. [3]
April 2025 was exceptional: US tariff announcements increased volatility and demand for hedges. That measurement window is not an average for the whole year. The BIS explains the context in its December 2025 analysis. [4]
Turnover measures contracts agreed during a period. It is not account balances, capitalisation or a pool available for distribution. The same financing needs can create successive transactions. The number does not establish an intermediary’s safety. The lesson on market size explains methodology and instruments.
Using USD to express turnover does not mean every contract includes the dollar. The dollar’s share in the final data was about 89.1%, but all currency shares sum to 200% because every transaction has two currencies. [3] “The dollar appeared in about 89% of turnover” therefore does not leave 11% for every other currency. This is another case where a large number without its counting method leads to a false conclusion.
16. “Buying an EUR/USD CFD means buying euros as at a bank”
Verdict: false.
A CFD is a derivative. The parties settle price changes under their agreement; the underlying can be a currency, index or another asset. This does not deliver euros into an ordinary currency account. KNF’s definition and examples make that distinction. [10]
A pair’s name on a screen identifies the price reference rather than automatically determining settlement. A positive CFD position is not the same service as buying euros to pay an invoice. “What is forex?” maps instruments and separates price from the subject of the contract.
17. “Every forex transaction needs leverage”
Verdict: false.
Exchanging owned domestic currency (such as dollars or sterling) for euros does not require exposure greater than the funds available. A margined account has a different structure. Leverage in some retail currency products does not make it a condition of every exchange.
The CFTC advisory distinguishes leveraged retail transactions and their risks. [9] This scope matters: margin and forced-close-out warnings do not describe an ordinary purchase of funds for a currency account. The agreement and specification determine product terms, including possible leverage. The leverage and margin lesson explains the mechanism.
18. “A demo result proves what I will earn on a live account”
Verdict: false.
Demo orders and results are simulated. The account teaches platform operation and tests assumptions in a specified model. It does not establish identical live execution prices, costs, liquidity or delays.
The CFTC’s 2007 hypothetical-performance warning explicitly identifies simulation limitations and the absence of a guarantee of similar live results. [6] Demo is a learning and testing tool. A presented result must clearly identify simulation, particularly if it persuades someone to buy a service. Backtesting and forward testing explains the distinction between tests and results.
Operating a platform and deciding how to take risk are different skills
Demo helps practise tasks: identifying an order type, reading volume, checking how to close a position and finding transaction history. It can also reveal a flaw in a rule or code. These benefits need not be dismissed to describe limitations honestly. There is no actual monetary consequence, however, and simulation conditions can differ from a live account.
In a hypothetical example, a person respects the stop on demo but begins moving it when real savings are involved to avoid closing a loss. Results then concern different behaviour as well as the same signals. Not everyone responds identically, and demo alone cannot quantify the difference. A presentation using simulation as evidence of future income should disclose both its execution model and what was not tested.
19. “People trading from home create most forex turnover”
Verdict: false.
The final BIS table for global OTC FX in April 2025 shows dominance of dealers and other financial institutions. Net-net adjusts interdealer double-counting. The retail-driven row is an additional breakdown under the survey definition, rather than “all private individuals worldwide”. [3]
Turnover shares use contract notionals rather than the number of people using an app. Counterparty data show who contracted; their motives, including hedging or speculation, are separate. Market size explains the structure, and retail forex trading covers the client segment.
What exactly does the BIS structure show?
In the same final Table 1, reporting dealers accounted for approximately 46.7%, other financial institutions 48.6%, and non-financial customers 4.6%. This classifies the reporting dealer’s counterparty, rather than who “trades professionally” or why a trade occurs. The small difference from 100% results from rounding the displayed shares. A non-financial customer is not synonymous with a private individual: the category includes businesses outside finance. [3]
The “of which: retail-driven” row is $241,990 million in this edition, or $241.99 billion per day, approximately 2.5% of global turnover. It is an additional BIS-defined breakdown, including flows through retail transaction aggregators. It is not added to the three counterparty categories as a fourth part of the total. Nor is it a registry of every CFD account. A popular app’s user count and notional share in this survey are not comparable measures.
The client’s order and the broker’s hedge are two operations
In a hypothetical CFD model, the client contracts with the firm; the firm may separately hedge its resulting exposure. It may also offset opposing client needs before executing additional transactions. Not every client click therefore becomes a separate identical order in the global market’s core.
For risk retained by the firm, the client contract’s payout affects its result; a hedge adds a second contract’s outcome. “A-book”, “B-book”, “STP” or “ECN” alone does not reveal the entire structure or every conflict of interest. Nor does a percentage of losing accounts measure how much risk was hedged. Execution policy and an accurate service description are needed, rather than an inference from a label. [9][10]
Opposing positions and conflicts of interest: a simple model
A separate simplified example: client A holds €10,000 of long exposure and client B €8,000 short on the same pair under matching terms. As counterparty to both contracts, the firm has the opposite result on each; before additional hedging, it has a net €2,000 short exposure in this model. It can hedge that with a separate external long position. This does not mean A’s order “met” B’s on an exchange or that the clients entered a contract with each other.
If A profits on the contract, that component of the firm’s result is negative. B’s result, the hedge and fees can nevertheless change the firm’s overall result. This explains the structural conflict when risk remains on the firm’s books, and why its revenue cannot be calculated from the percentage of losing clients alone. Actual hedging and operating-cost information are needed.
Encouraging more frequent trading can increase fee revenue; unhedged risk creates an additional relationship between contract results and the firm’s outcome. These mechanisms do not automatically establish fraud or one cause of client losses. Aggressive encouragement to deposit more or increase positions should prompt examination of the terms and conflicts. “Commission-free” also does not mean cost-free: a markup can sit within the spread. A mandatory risk warning, an execution model and a firm’s revenue measure three different things.
20. “A central bank’s announced exchange rate will be maintained forever”
Verdict: false.
A central bank can influence exchange rates through interest rates, communication and FX transactions. Maintaining a level or boundary is nevertheless a commitment with costs and conditions. Changing conditions can lead to a policy change.
Case study: why the SNB changed its EUR/CHF rule
On 6 September 2011, the Swiss National Bank (SNB) announced it would not tolerate a rate below CHF 1.20 per euro. It cited franc overvaluation, risks to the economy and deflation, meaning a general price decline. It declared readiness to buy foreign currency in unlimited quantities. [16] This was a EUR/CHF floor: fewer francs per euro means a stronger franc. The floor aimed to prevent precisely that appreciation while allowing a higher EUR/CHF rate.
Buying foreign currency for francs helped defend the floor but increased the bank’s foreign assets. The SNB had to assess the scale of purchases and balance-sheet risks over time. In March 2015, Governing Board member Fritz Zurbrügg described stronger pressure in late 2014 and diverging policy in major currency areas: expectations of higher US rates and further euro-area easing. In that assessment, keeping the floor would require increasing interventions and expose the bank to disproportionate risk. This is the institution’s own explanation of its decision. [18]
On 15 January 2015 the SNB discontinued the minimum rate and lowered the interest rate on covered portions of bank deposits to −0.75%. [11], [17] The decision surprised the market. The franc appreciated sharply; in the March speech the SNB also described liquidity constraints during the response. [18]
The mechanism matters: participants could previously factor in the promised defence of the boundary, but after the decision they had to price the currency without it. The SNB retained the ability to intervene. [17] This concerned withdrawal of a specific rule rather than a technical “running out of francs” or the end of every influence on the currency.
The history does not predict when another bank will change its rules. It shows why a policy announcement must be read in the context of its goals and conditions rather than as an everlasting rate guarantee. The central-bank lesson explains instruments and constraints.
Why does this history matter for orders and margin?
A policy change differs from an ordinary move of a few more pips. If many participants want to change positions simultaneously, earlier quotes may disappear and the next execution price can be far away. An ordinary stop does not turn that situation into a guaranteed exit. The SNB lesson is therefore not that “a safer stop could always have been chosen”, but that price risk, quote availability and execution must be separated.
The 2015 event does not determine today’s negative balance protection at a specific intermediary. Nor should the EUR/CHF floor be turned into a fixed rate in both directions, or one platform’s temporary low into the entire market’s common price. The mechanism matters without an apparently precise, universal percentage decline.
Intermediaries were affected too. The FCA confirmed that Alpari (UK) Limited entered special administration on 19 January 2015 because of insolvency. In its 2015/16 report, the UK Financial Services Compensation Scheme (FSCS) linked the failure to the market response following the SNB decision and described handling client claims. [29], [30] This is a specific example of intermediary risk and protective procedures, rather than evidence that every regulated firm will fail or that compensation covers losses on any trade.
21. “Only interest rates determine a currency’s exchange rate”
Verdict: false — rates matter, but are not the only factor.
Interest-rate comparisons affect the appeal of assets in different currencies. Markets also consider future decisions, inflation, risk and currency demand. The SNB’s explanation of the franc highlights both rate differences and safe-haven demand under uncertainty. [12]
Reading two current policy rates cannot give a certain direction. The same announcement can change expectations differently from what the interest-rate level alone suggests. The SNB explanation concerns the franc, not a universal formula for every pair. The exchange-rate drivers lesson explains factors and their interactions.
Currency demand can have an urgent deadline
March 2020 provides a documented example of funding needs. The Federal Reserve explained its expanded swap lines by stresses in dollar funding outside the US and the need to maintain credit flows. Dollars went to foreign central banks, which could provide them to institutions in their jurisdictions. [28] This liquidity-demand mechanism cannot be reduced to current policy-rate differences alone.
A participant needing currency for repayment or collateral at a specified time need not wait for an indicator to become “oversold”. A separate explanatory scenario: a company has a dollar payment tomorrow, so buying dollars solves the payment problem even if the chart’s price looks high. An indicator describes price data; it does not independently reveal every trade’s deadline and constraint. This does not make all technical methods worthless in a crisis. It means a signal cannot replace an account of market needs and risks.
22. “Without one exchange, a broker can quote any price”
Verdict: false.
A firm may use its own quote stream without being entitled to change conditions arbitrarily or falsify execution. The CFTC has documented enforcement against trading-system misconduct. [5] Contractual terms, price formation and an intermediary’s jurisdiction-specific duties matter.
Comparison requires the same instrument and time. Different quotes can have an explanation, but “there is no common exchange” does not answer every complaint. Execution quality explains assessment without presuming either guilt or innocence.
23. “Forex is a pyramid scheme”
Verdict: false for the market; a particular offer may be fraudulent.
Exchanging currencies and settling contracts do not require paying participants from new investors’ deposits. That characterises a Ponzi scheme. A pyramid can base compensation mainly on recruitment. Both mechanisms can appear together in offers advertised as “forex investment”.
A documented example is Mirror Trading International: the CFTC describes a claimed FX robot and displayed balances masking a Ponzi scheme. [7] The relevant question is the source of payouts and the entity’s actual operations. A legal market, large turnover or familiar app does not confirm an offer’s honesty. Fake brokers and scams explains the mechanisms.
A checklist for a specific offer
- Identify the subject. Is it delivered currency, CFDs, futures, one broker or the entire market? This can change the answer.
- Check the unit and period. A client, account and trade differ; an annual result is not one position’s outcome.
- Open the source. A number should lead to a table or document rather than an advertiser repeating it.
- Find the limit of the conclusion. A specific manipulation case does not establish universal collusion; high turnover does not prove safety.
- Separate a result from a promise. Demo charts, selected profitable trades and an “AI” label do not guarantee income.
Continue to forex basics and mechanisms. Understanding bid and ask, contract types and order rules lets you check many claims yourself. When evaluating a specific intermediary or funded-account offer, you can also score its licence, execution rules and cost disclosures using the broker and prop due diligence scorecards.
Copying decisions does not replace assessment of results and risk
In copy trading, choosing a leader is also a risk decision. A ranking showing only current winners does not independently establish the outcomes of all earlier participants. This is a sample-selection problem: a few successful histories can conceal the absence of a complete picture. Check observation length, maximum drawdown, open positions, changes of style and the follower’s costs. This does not assume every platform hides unsuccessful participants; it requires information that allows assessment.
Scale matters as much. In a model, a leader with $10,000 capital holds €10,000 at EUR/USD 1.10: $11,000 exposure is 1.1 times capital. Copying exactly that amount with $1,000 capital would produce 11 times capital. Copying one tenth would produce 1.1 times under these assumptions, without guaranteeing identical prices and costs. The model does not describe any platform’s settings. It shows why copying notional size and copying a risk proportion are different things.
ESMA’s 2023 supervisory briefing examines copy-trading service classification, client information, costs and investor protection. [19] The service name and leader’s history do not replace identifying who decides, what authority exists to change those decisions, and whether follower results reflect delays, limits and charges.
A listed group’s report and an account agreement are different documents
Public statements and an audit can provide information about a group’s activities. They guarantee neither future solvency nor that the account is contracted with the entity whose shares are listed. Identify the actual counterparty, supervision and client-money arrangements. Group results are also not a simple measure of earnings from one client’s losses: they can combine fees, contracts, hedges and other business lines.
Sources available for independent checking
- Scale and instruments: the final BIS tables in source [3]; first check the period, unit and footnote for the selected row.
- Outcomes and risk: the Polish UKNF report [1] and the warning of the actual contracting entity. Record the access date, product scope and calculation method; several warnings do not automatically form a market average.
- Individual entities’ warning histories: riskwarnings.com, a project of the MyBank.pl and ForexMechanics team. This supplementary registry links to archived disclosures; it is not a financial supervisor. Check each observation’s date and status and follow the original warning; a lower percentage is not a broker-quality rating. [31]
- The entity: the relevant supervisory register and warning list; compare with the contracting entity and genuine contacts, as in the FCA example [23].
- Wholesale-market practices: the FX Global Code [24]; apply it within its scope, without treating a statement of commitment as a retail licence.
- Performance evidence: full history, costs and simulation versus live execution; assess advertising also in light of the limitations described by the CFTC [6].
A paid course, program or analysis service can contain useful material. Charging a fee does not establish fraud, and a high price does not establish quality. Require a clear service description and separation of education from guarantees of future results. Likewise, possible profit is not promised profit: the complete series after costs and its risks provide stronger evidence than a screenshot of one successful trade.
Questions and answers
Do 90% of forex traders really lose?
There is no fixed percentage describing every participant. For 2025, Poland’s KNF reported losses for 72.2% of clients of domestic UKNF-supervised entities. The table includes Polish and foreign residents and excludes zero results. It measures net realised annual results in OTC derivatives, not currencies alone or the share of losing trades.
Are forex and a currency-pair CFD the same thing?
Forex is the market for currency exchange and related instruments. A currency-pair CFD is a specific derivative settling price changes under contractual terms. Opening it does not deliver the purchased currency into a currency account.
Do differences between charts prove manipulation?
A difference alone is insufficient. Compare the same instrument, moment and price type: bid, ask or midpoint. Quotes and costs can create differences. Suspected execution problems require order history and the intermediary’s applicable rules.
Will a stop-loss always close at the specified price?
An ordinary stop-loss does not guarantee that price. Once its trigger is met, execution depends on order rules and available prices; rapid moves can cause slippage. A guaranteed stop, if available, is a separate service with its own terms.
Can a robot or AI guarantee profit?
No. Automation helps execute specified rules but does not remove uncertainty, costs or changing-market risk. A simulation or selected profitable period does not establish similar future results. A risk-free-profit promise requires particularly critical scrutiny.
Is forex a pyramid scheme?
The currency market itself is not a pyramid. A fraudulent scheme can nevertheless use the forex name and apparent platform results. A Ponzi scheme funds payouts from new deposits rather than the claimed business activity. A legal market does not confirm a particular firm’s honesty.
Is forex legal?
Currency exchange and specified investment services can be provided lawfully by authorised entities in most major jurisdictions. Identify the product, the contracting legal entity and the scope of its permission. A legal market does not legitimise every firm using its name. Checking the relevant supervisory register, entity details and agreement matters more than a familiar platform logo.
Should I treat a 30:1 limit as a recommended position size?
No. The limit specifies the available ratio of exposure to required margin for a product and regulatory regime. Actual leverage depends on the selected position and capital; lower exposure can be used. Professional-client or other-jurisdiction rules need separate checks and may provide different protections.
How do A-book, B-book and internalisation differ?
The labels usually describe routing or hedging of client risk, but are not one precise classification of all contracts. A CFD counterparty can offset opposing positions and hedge some risk externally. The client contract and hedge have separate outcomes. A label alone does not prove integrity, quote quality or how much risk the firm retains.
Can forex trading be profitable?
A positive result is possible, but possibility is not a guarantee of regular income. The complete outcome series, costs, risk, capital and execution terms matter. A percentage of profitable clients in one year does not establish persistent profitability for every person in that group. Demo results and selected successful trades are also insufficient evidence.
Why does forex operate almost around the clock, but not uniformly all week?
Activity moves between centres in different time zones. The normal wholesale trading week starts on Monday in Sydney and ends on Friday in New York; European times also depend on clock changes. This does not mean one session or constant liquidity. Weekend availability of a product comes from its terms rather than guaranteed activity throughout the market.
Does a positive swap credit guarantee profit?
A positive account accrual is one component of the result, not a guarantee. Exchange-rate changes, spreads, commissions and funding costs can exceed it. The rate and charging schedule come from the product terms and can change. A CFD overnight charge or credit is not the same instrument as an institutional FX swap.
Does one EUR/USD lot always mean $100,000 exposure?
With a standard contract size, one lot means 100,000 EUR units of the base currency. At hypothetical EUR/USD 1.10, that equals $110,000. One pip, 0.0001 USD per EUR, is worth $10 for that position; a 50-pip move changes value by $500 before costs. Check the specification and compare position size with capital; this is not a volume recommendation.
Does copy trading remove risk because someone else decides?
No. It changes how decisions are made or executed but retains instrument, cost, position-scaling and provider-behaviour risks. Leader and follower results can differ because of prices, delays and account settings. ESMA’s 2023 supervisory briefing addresses service classification, client information, costs and suitability; a list of leading returns does not replace those checks.
Is a listed broker safe by definition?
No. Public reporting and audit can assist group analysis, but guarantee neither solvency nor proper order execution. The account may be with a subsidiary in a different jurisdiction from the listed group. Check the actual counterparty, permission, client-money protections and terms; a familiar name and public valuation do not replace that identification.
Sources and data coverage
Sources checked on 12 October 2026. Regulatory reports and cases from different years do not form one common survey. US examples establish particular events and evidence standards; they do not replace checking the law and agreement governing a particular firm.
- UKNF, Forex-market client results for 2025, published 27 March 2026, Tables 1–2 on pages numbered 1–2. Annual realised client results in OTC derivatives, excluding zero outcomes.
- ESMA, ESMA agrees to prohibit binary options and restrict CFDs to protect retail investors, 27 March 2018. Historical CFD-account analyses and intervention decision.
- BIS, 2025 Triennial Central Bank Survey — Detailed tables, final June 2026 annex, Table 1. Average daily global OTC FX turnover in April 2025, net-net.
- BIS, Global FX markets when hedging takes centre stage, December 2025. Different motives and increased volatility and hedging after US tariff announcements.
- CFTC, Forex Capital Markets LLC Ordered to Pay More Than $14.2 Million…, 3 October 2011. Findings on asymmetric slippage in a specific case.
- CFTC, Advertising by Commodity Pool Operators, Commodity Trading Advisors, and the Principals Thereof, Federal Register, 23 February 2007. Hypothetical performance and selective advertising.
- CFTC, Customer Advisory: AI Won’t Turn Trading Bots into Money Machines, 2024. Automated-profit promises and Mirror Trading International.
- US Department of Justice, Five Major Banks Agree to Parent-Level Guilty Pleas, 20 May 2015. Four specified banks’ dollar/euro collusion; the fifth agreement concerned LIBOR.
- CFTC, Eight Things You Should Know Before Trading Forex. US retail OTC advisory: dealer relationship, platforms and price comparison.
- UKNF, Forex questions and answers. CFD definitions, intermediaries, prices and contract-settlement examples. Historical negative-balance warnings are not applied to every present contract.
- SNB, Chronicle of monetary events, January 2015 entry. Removal of the EUR/CHF 1.20 floor on 15 January 2015.
- SNB, What determines the Swiss franc exchange rate?. Interest-rate differences, stability and safe-haven demand.
- ASIC Moneysmart, Forex trading, updated 10 September 2026. Margin FX versus currency conversion; Australian classification as a CFD and stop-order conditions.
- Australian Foreign Exchange Committee, Questions and Answers, question 3. Normal trading week and absence of a single fixed daily session.
- OANDA, REST-V20 Order Definitions, accessed 29 October 2026; StopLossOrder and triggerCondition sections. One platform’s quoted-side and trigger-condition model, rather than every FX contract.
- SNB, Swiss National Bank sets minimum exchange rate at CHF 1.20 per euro, 6 September 2011, p. 1. Floor purpose and foreign-currency purchases.
- SNB, Swiss National Bank discontinues minimum exchange rate and lowers interest rate to −0.75%, 15 January 2015, p. 1. Removal, interest-rate reduction and retained intervention capacity.
- Fritz Zurbrügg, After the minimum exchange rate: new monetary policy challenges, 26 March 2015 speech, pp. 2–6. The bank’s explanation, currency pressure and market response.
- ESMA, Supervisory briefing on firms offering copy trading services (PDF), 30 March 2023. Service classification, client information, costs and investor-protection expectations; not a source of guaranteed returns.
- Osler C. L., Stop-Loss Orders and Price Cascades in Currency Markets, Federal Reserve Bank of New York, Staff Report 150, July 2002; published version: Journal of International Money and Finance 24(2), March 2005, pp. 219–241. Empirical evidence on cascades, not deliberate activation of every stop.
- CFTC, 17 CFR §5.5, 1 April 2025 edition, paragraph (e), p. 332: US quarterly-outcome disclosures. Also checked against the current eCFR text on 29 October 2026; the cited calculation provisions remain present.
- CFTC, 17 CFR §5.18, 1 April 2025 edition, paragraph (i), p. 352: profitable and unprofitable account calculations. Also checked against the current eCFR text on 29 October 2026; the cited calculation provisions remain present.
- FCA, Clone firms and individuals, updated 14 May 2025: copied identities and checking contact details.
- GFXC, FX Global Code, December 2024, foreword, 55 principles and Principle 17: wholesale code, not law or retail permission.
- Park C. H., Irwin S. H., What do we know about the profitability of technical analysis?, Journal of Economic Surveys 21(4), 2007, pp. 786–826; university-repository abstract read. Mixed findings and testing limitations.
- BIS Markets Committee, FX execution algorithms and market functioning, October 2020, report overview: matching efficiency and a shift of execution risk.
- Bank of England, Operation of monetary policy, Quarterly Bulletin, 1 December 1992, July–September account: conflicting goals and suspended sterling ERM membership.
- Federal Reserve Board, Swap Lines FAQs, 19 March 2020: dollar-funding stresses and central-bank intermediation.
- FCA, News for customers of Alpari (UK) Limited, 20 January 2015, questions 1–2 and 7: insolvency, 19 January proceedings and conditional compensation access.
- FSCS, Annual Report and Accounts 2015/16, p. 25 (physical PDF page 25), Alpari case study: failure following the SNB decision and handling of claims.
- riskwarnings.com, CFD Risk Disclosure Registry, homepage and scope read on 29 October 2026. A supplementary archive by the MyBank.pl/ForexMechanics team; not a universal loss percentage or licence source.